
Figure 2.
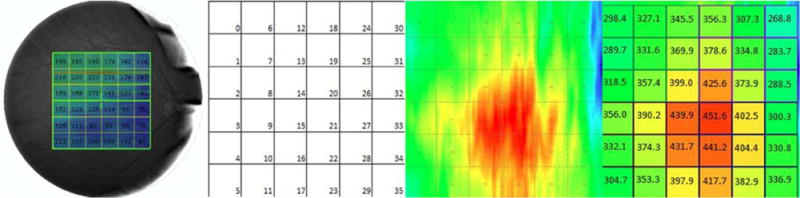
Fundus image showing choroidal thickness measures and example of choroidal thickness map of one eye from spectral domain optical coherence tomography (OCT). A square grid with 6×6 cells centred on the fovea was positioned over the choroidal thickness map. The mean choroidal thickness value was computed for every grid cell with a size of 1×1 mm2 each. All 36 (6×6) choroidal thickness values were compared between the two machines (spectral domain OCT and swept source OCT) and between manual and automated segmentations for each of the machines. (Left) Example of choroidal thickness map obtained from a commercial grid of the Topcon swept source OCT machine software. This grid consists of 6×6 cells with a length and width of 1 mm for each cell. This grid was subsequently used for developing the standardised choroidal thickness measurement method presented in this study. (Second) Choroidal grid with 6×6 cells, each cell comprising 1×1 mm2 is shown. (Third) Automated segmented map showing choroidal thickness in swept source OCT. (Right) Average choroidal thickness values for all 36 cells is shown.