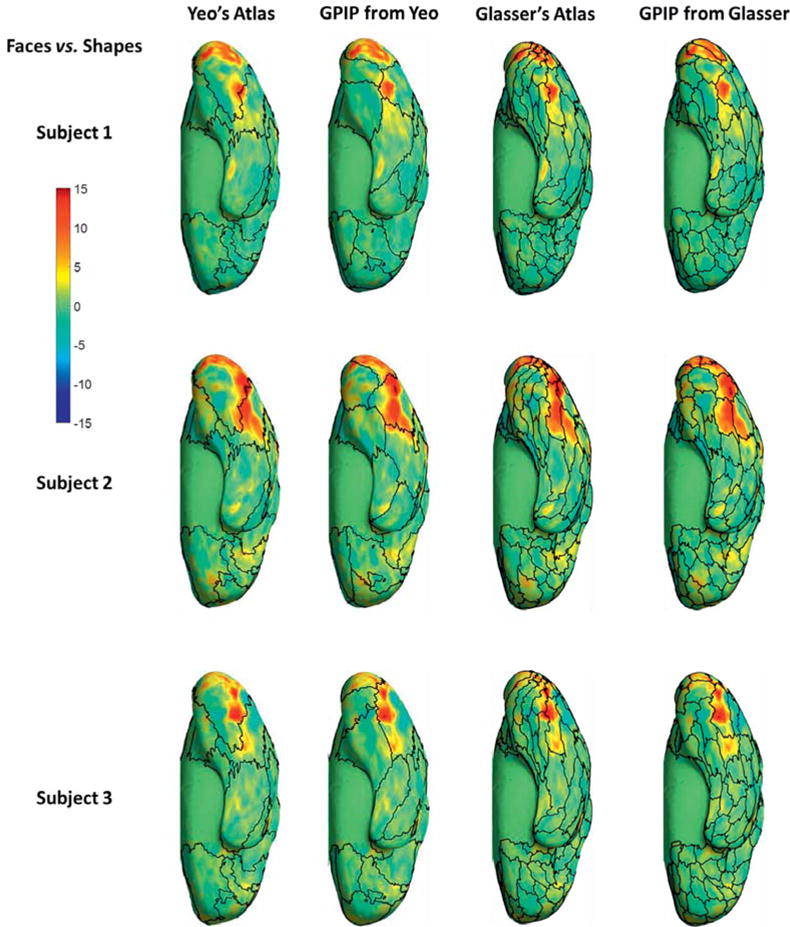
Figure 5.

Comparison of resting fMRI parcellation and activation maps for the faces vs. shapes visual task pair, ventral view of right hemisphere. First and third columns: initial parcellations using the Yeo and Glasser atlas, respectively, with boundaries indicated by black curves. These are overlaid with color maps of z-scores computed for the faces vs. shapes contrast for three subjects. Second and Fourth columns: final parcellation boundaries initialized from the Yeo and Glasser atlas respectively.
