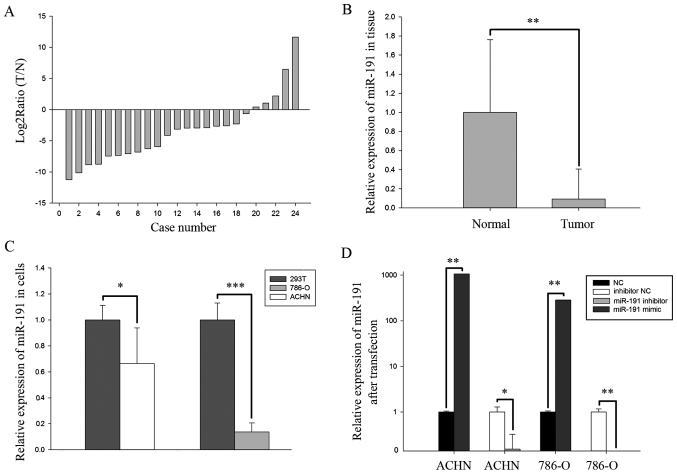
Figure 1.
(A) Log2 T/N ratio of miR-191-5p, and (B) relative expression of miR-191-5p in 24 paired clinical specimens of RCC and adjacent normal tissues. (C) Relative expression levels of miR-191-5p in the normal 293T cells and two RCC cell lines (ACHN and 786-O). (D) Relative expression levels of miR-191-5p in ACHN and 786-O cell lines after transfection with mimics or inhibitors. *P<0.05, **P<0.01 and ***P<0.001. RCC, renal cell carcinoma; miR, microRNA; NC, negative control; T, RCC tissues; N, normal tissues.

