
Figure 3.
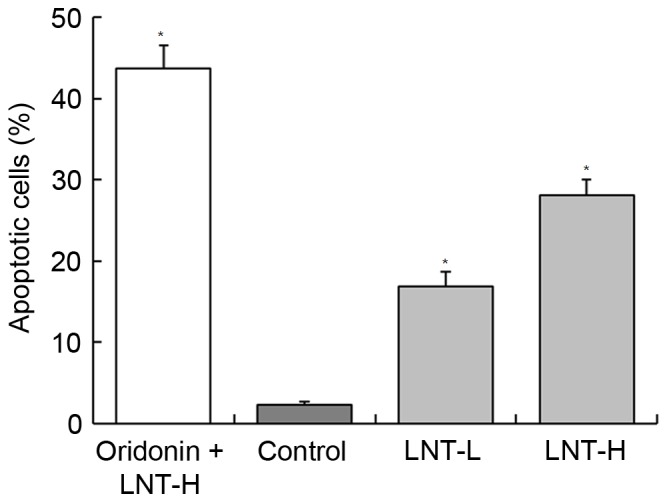
Flow cytometric analysis of the percentage of apoptotic HepG2 human hepatoblastoma cells. The DNA content of the sub-G1 phase was evaluated. a-d*Mean values with different letters over the bars are significantly different (P<0.05) according to Duncan's multiple range test. Oridonin + LNT-H, 20 µg/ml oridonin + 200 µg/ml lentinan; LNT-L, 100 µg/ml lentinan; LNT-H, 200 µg/ml; LNT, lentinan.