Figure 2.
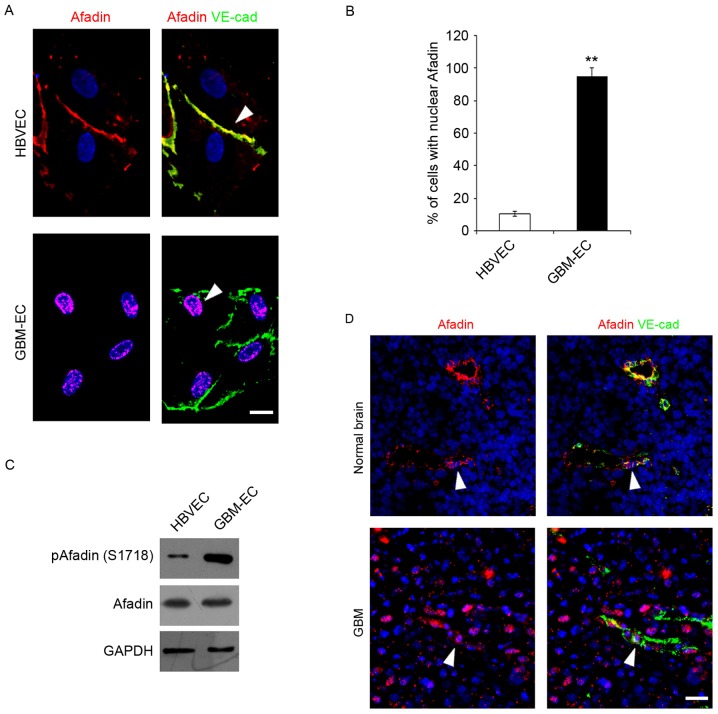
Immunocytofluorescence analysis and western blot assay detecting phosphorylation and localization of Afadin. (A) Immunofluorescence was performed with the indicated antibodies: Afadin (red); VE-cadherin (green); and DAPI (blue). HBVECs exhibited Afadin cell junction distribution (arrow), while GBM-ECs exhibited Afadin nuclear location (arrow). Images are representative of multiple fields of view and of three independent experiments. Scale bars, 10 µm. (B) Quantification of the nuclear staining is presented in the bar graph. Error bars are the mean ± standard error. (C) Western blotting indicated the phosphorylation and expression of Afadin in HBVECs and GBM-ECs. (D) Afadin demonstrated nuclear localization in GBM vessels (arrows) as compared with cell membrane distribution in normal brain tissue (arrows). Afadin (red), VE-cadherin (green) and DAPI (blue). Representative images are presented, with scale bars, 50 µm. **P<0.01 vs. HBVECs, assessed using Student's t-test. VE-cad, vascular endothelial cadherin; HBVEC, human brain vascular endothelial cells; GBM-ECs, glioblastoma endothelial cells.

