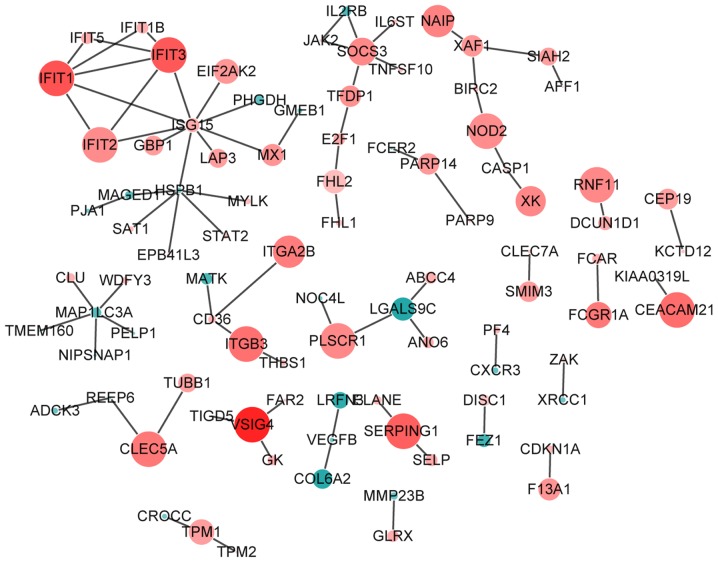
Figure 5.
AS-specific protein-protein interaction network. Nodes (circles) represent the proteins encoded by DEGs. The radius of the circle indicates the significance of enrichment, a red color indicates that the DEG is upregulated and a green color indicates that the DEG is downregulated. DEG, differentially expressed gene.

