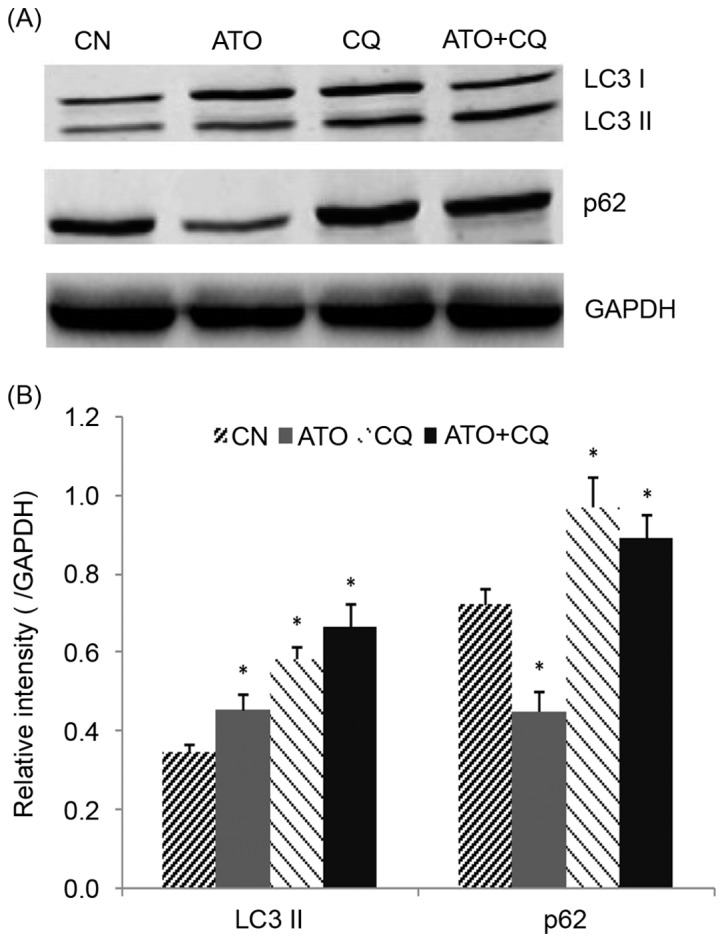
Figure 5.

The effect of ATO and CQ treatments on the expression of autophagy-associated proteins. (A) Protein extracts of the NB4 cells were analyzed for LC3-II and p62 expression by western blotting. (B) Quantification of the western blotting. *P<0.05 compared with the control group. ATO, arsenic trioxide; CQ, chloroquine; LC-II, light chain II; CN, control.
