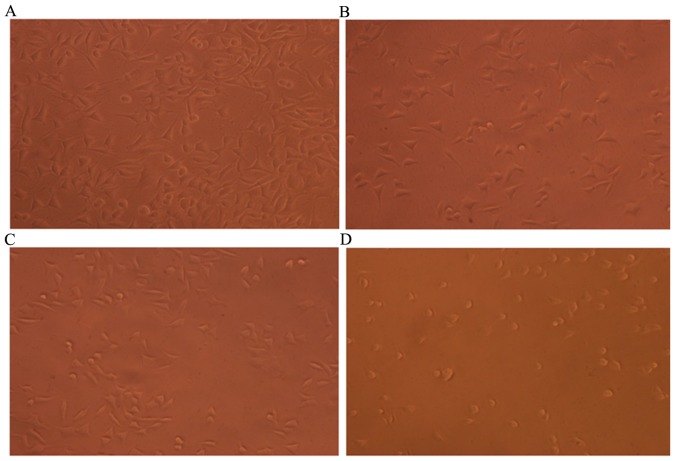
Figure 6.
Cell growth in the different treatment groups. (A) Blank; (B) low-dose (5 mg/ml); (C) moderate-dose (10 mg/ml); and (D) high-dose (20 mg/ml) groups. Morphology of MKN45 cells treated with flavonoid (0.0, 5.0, 10.0 and 20.0 mg/ml) for 24 h was observed using a IX70 inverted phase-contrast microscope (magnification, ×200).

