
Figure 4.
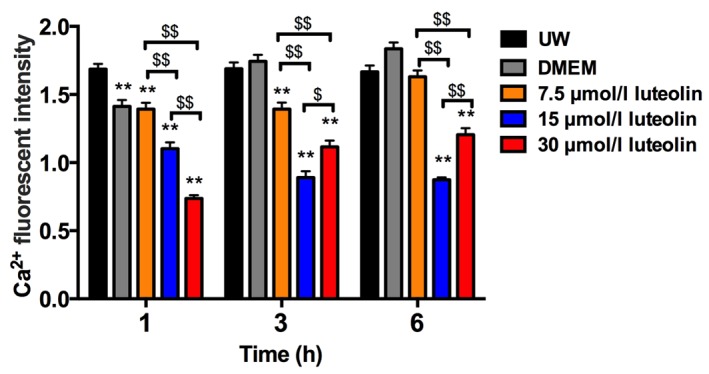
Fluorescence intensity of mitochondrial Ca2+ in the different groups. Data are presented as the mean ± standard error of the mean. Experiments were performed in triplicate. **P<0.01 vs. UW solution group. $$P<0.01, $P<0.05. UW solution, University of Wisconsin solution; DMEM, Dulbecco's modified Eagle's medium.