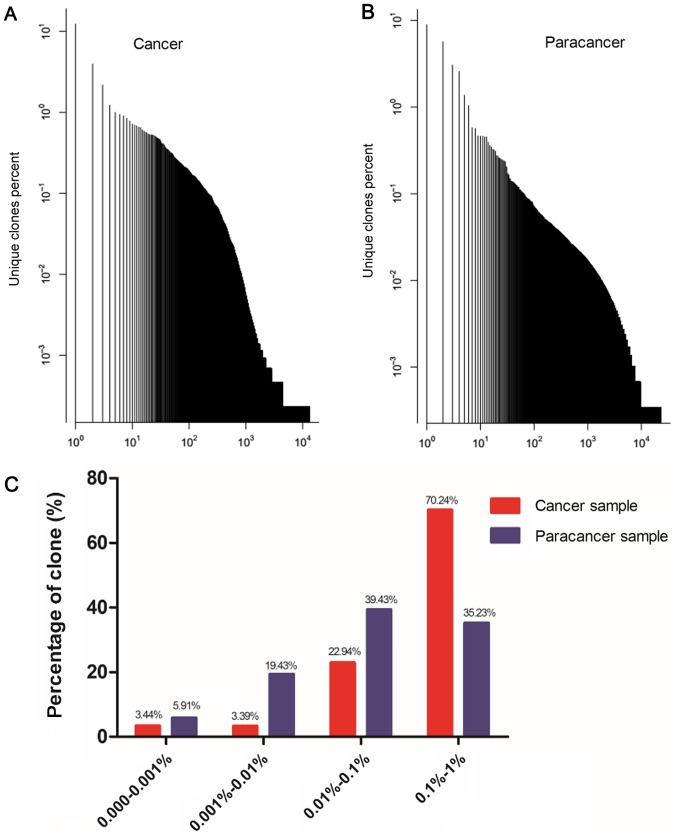
Figure 1.
Clone frequency distribution in the Texas Cancer Research Biobank sequences of prostate cancer sample and paracancer sample. (A) Plot of the unique clones' percent in cancer sample; (B) plot of the unique clones' percent in paracancer sample; (C) percentage of unique clones in different degree of expansion in cancer sample and paracancer sample.

