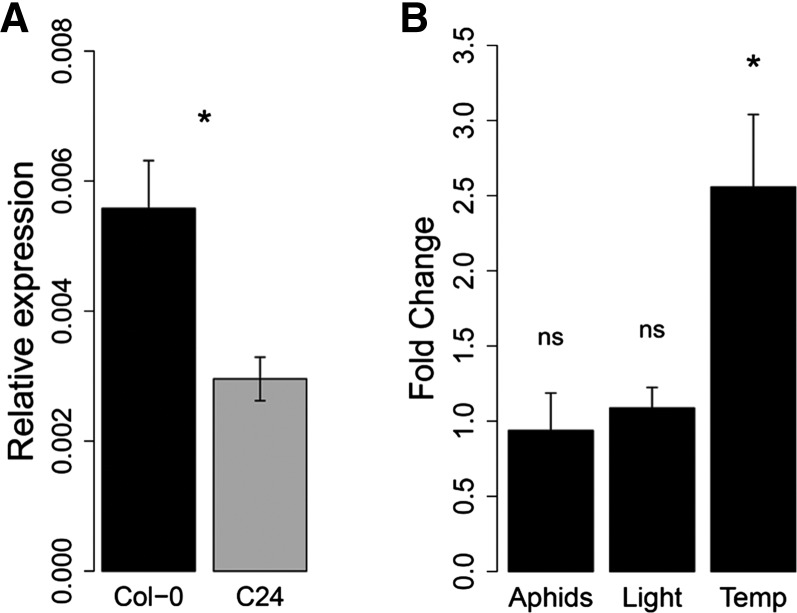
Figure 3.
SLI1 Expression.
(A) SLI1 expression in Col-0 and C24 leaves (Mann-Whitney U test, P = 0.03, n = 4, plants were grown at 26°C).
(B) Expression in Col-0 rosette leaves under different light intensity, temperature, and aphid treatments (measured by RT-qPCR): clean plants versus plants 6 h postinfestation (P = 0.57, n = 4); light intensity 70 versus 120 μmol m−2 s−1 (P = 0.74, n = 3); 26°C versus 20°C (P = 0.042, n = 8), one-way ANOVA; data represent mean ± se.

