Figure 4.
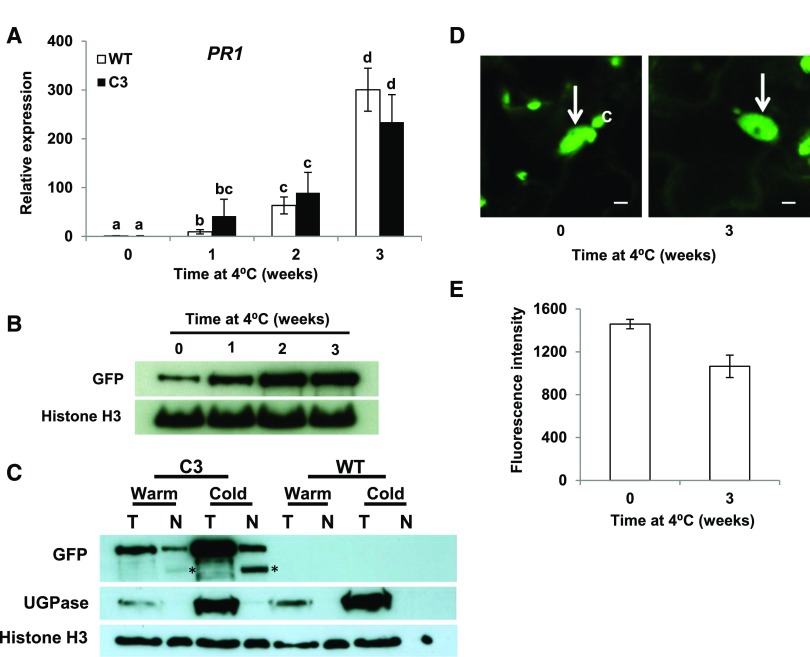
Induction of PR1 in Plants Exposed to Low Temperature Does Not Involve Degradation of CAMTA3 or Exclusion of CAMTA3 from the Nucleus.
(A) Expression of PR1 in plants exposed to low temperature. wild-type and C3 transgenic plants were grown at 22°C under a 12-h photoperiod and transferred to 4°C for the indicated times. Relative transcript levels of PR1 were determined by RT-qPCR. Data were subjected to ANOVA as detailed in Methods. Error bars indicate se (n = 3 biological replicates). Bars marked with different letters are significantly different (LSD, P < 0.05).
(B) CAMTA3-GFP levels in the C3 transgenic line. Protein levels were determined by immunoblot analysis using anti-GFP antibody. Histone H3 served as the loading control. Plants were grown as in (A).
(C) CAMTA3-GFP levels in total (T) and nuclear (N) protein preparations in C3 and wild-type plants grown at warm (warm) temperature or grown at warm temperature and cold-treated (cold) for 3 weeks at 4°C. Approximately equal amounts of nuclear protein were run in each lane, indicated by amounts of histone H3. UGPase antibody was used to detect the cytoplasmic protein maker, UDP-glucose pyrophosphorylase. The bands marked with an asterisk are degradation product of CAMTA3-GFP (see text).
(D) Confocal optical sections from leaves of the C3 transgenic line showing CAMTA3-GFP present in the nucleus (arrow). Chloroplasts (C) also appear green due to chlorophyll autofluorescence. Plants were grown as in (A). Bars = 5 µm.
(E) Quantification of CAMTA3-GFP fluorescence intensity of nuclei. Fluorescence intensity of individual nuclei from separate cells was measured using a fixed ROI as described in Methods. Error bars indicate se: n = 36 (0 weeks) and 51 (3 weeks) nuclei.

