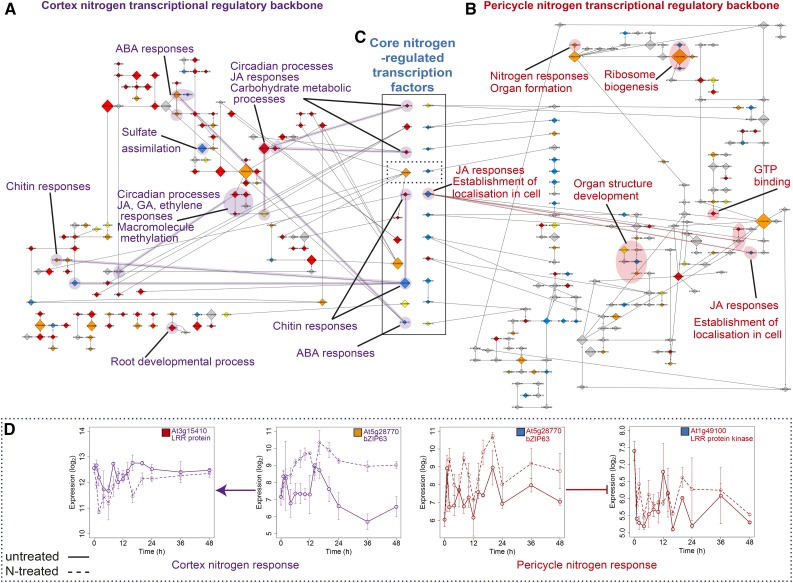
Figure 3.
Nitrogen Response Networks Are Modular in Their Cell-Type Organization, but Connected by Transcription Factor Regulation.
(A) and (B) Inferred causal transcription factor (backbone) network on CN (A) and PN (B) expression data. Node size is scaled by the outdegree of the module (number of targets) and colored according to response category: immediate (red), fast (orange), downstream (yellow), and late (blue) as in Figures 1 and 2 (see Supplemental Files 1 to 9). The edges denote that one TF regulates the other TF (and thus TF module), with regulation type (induction; arrow-headed lines or repression; bar-headed lines) shown by the arrowhead shape. Processes that are overrepresented among genes within module(s) are highlighted for each network.
(C) Transcription factors that are N-regulated in both cell types (core) have been located between the cortex and pericycle networks; within the solid box, each pair of nodes is the same transcription factor with the regulation timing and node size indicating interactions in the cortex (left) and pericycle (right). Directionality of the N response is evident in the earlier response of these in the cortex compared with the pericycle (see colors designating timing, as in Figure 1G).
(D) Targets of bZIP63, transcription factor in dotted line box section in (C). Expression profiles within time series of a transcription factor (At5g28770, bZIP63) that is core N-induced in both the cortex (fast) and pericycle (late), and predicted to regulate genes of similar function in each cell type, LRR protein At3g15410 in cortex (immediate) and LRR protein kinase At1g49100 in pericycle (late). Solid line, untreated (CU/PU); dashed line, N-treated (CN/PN); error bars indicate se with average sample size of 2.95 replicates.

