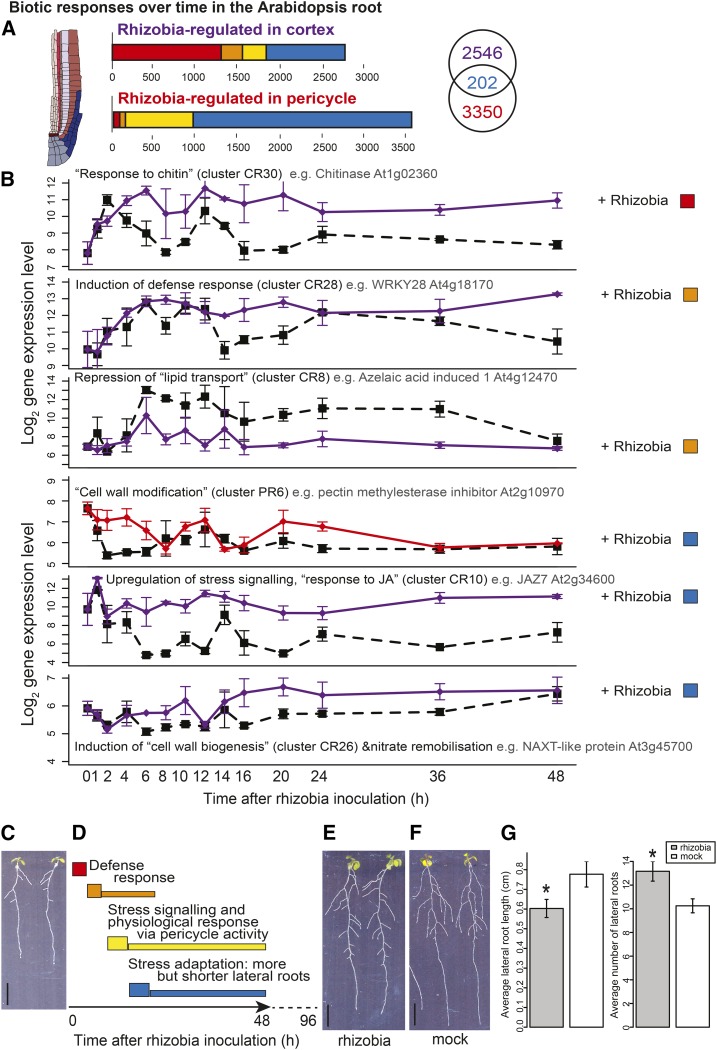
Figure 4.
Cortical and Pericycle Cells Partition Defense and Developmental Responses to Rhizobia.
(A) Numbers and time response partitioning of transcripts regulated by nitrogen in the cortex and pericycle.
(B) Timeline of processes affected by rhizobia, with the log2 expression of select indicative genes shown in rhizobia-inoculated and untreated cortical cells (purple lines) and pericycle cells (red lines). Among cortex clusters that contain an overrepresentation of transcripts involved in particular processes (GO terms) is an immediate upregulation of chitin responses, fast induction of defense responses, fast repression of lipid transport, late upregulation of stress signaling, and nitrate remobilization. Among pericycle clusters there is downstream modification of cell wall formation; see Supplemental Data Set 4 for GO overrepresentation analysis corrected P values and Supplemental Data Set 2 for cluster membership. Dashed black line, untreated (CU/PU); solid purple/red line, rhizobia-treated (CR/PR); error bars indicate se with average sample size of 2.95 replicates.
(C) Seedlings grown on nitrate-deplete conditions.
(D) Schematic timeline of gene expression changes after rhizobial inoculation, preceding root developmental changes (more but shorter lateral roots); labels based on summary of GO terms presented in (B). Solid arrow represents time series of gene expression analysis, and dotted line represents time up to phenotypic analysis images shown in (E) and (F).
(E) Seedlings 4 d after rhizobial inoculation.
(F) Seedlings 4 d after mock inoculation. Bars in (C), (E), and (F) = 1 cm.
(G) Average (n = 16) lateral root length (left) and number of lateral roots (right) of seedlings 4 d after rhizobial or mock inoculation; error bars = se; *t test P < 0.05. See Supplemental Data Set 3 for phenotype values and t test P values.

