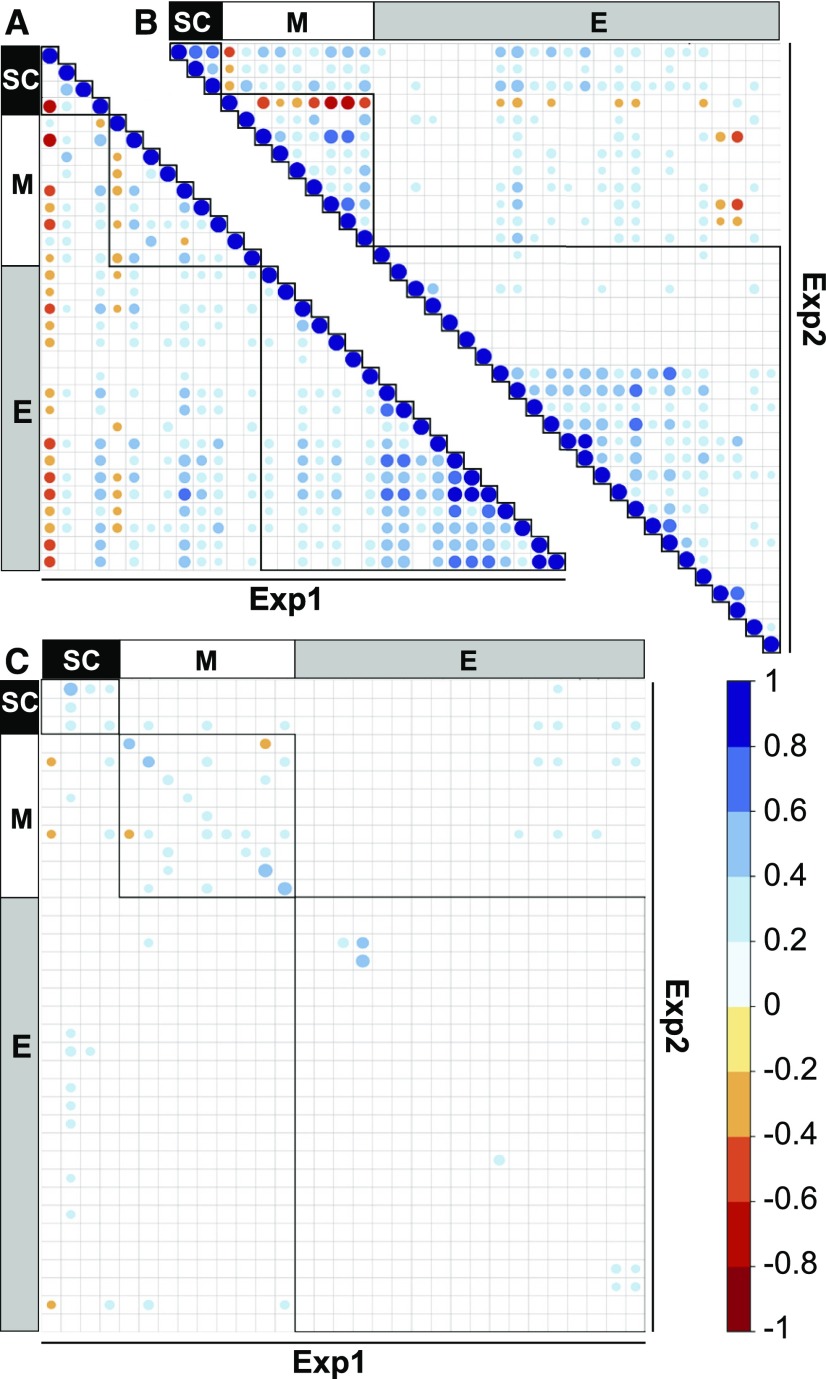
Figure 1.
Spearman Rank Correlation Matrices for Primary Metabolic Traits.
Two independent experiments (Exp1 and Exp2) were performed, differing in photoperiod (10 h versus 12 h) and the age of harvested plants (37 versus 28 DAS). This was done to increase robustness and to break pleiotropic correlations between traits, which might lead to false secondary associations. More traits were investigated in Exp2 than in Exp1; these traits are omitted here. A correlation scale is included to the right of (C): positive correlations are shown in shades of blue (1 to 0) and negative correlations in shades of red (−1 to 0). Coefficients are filtered according to Bonferroni correction (PB < 0.1). Correlations within the same trait category are highlighted with black frames (triangles in [A] and [B] and squares in [C]). All traits are expressed on a FW basis. The traits are arranged along the same axes and in the same order as they are listed in Supplemental Data Set 3. Names and abbreviations can be found in Table 1.
(A) Correlations between traits measured within Exp1.
(B) Correlations between traits measured within Exp2.
(C) Cross-correlations between Exp1 and Exp2.

