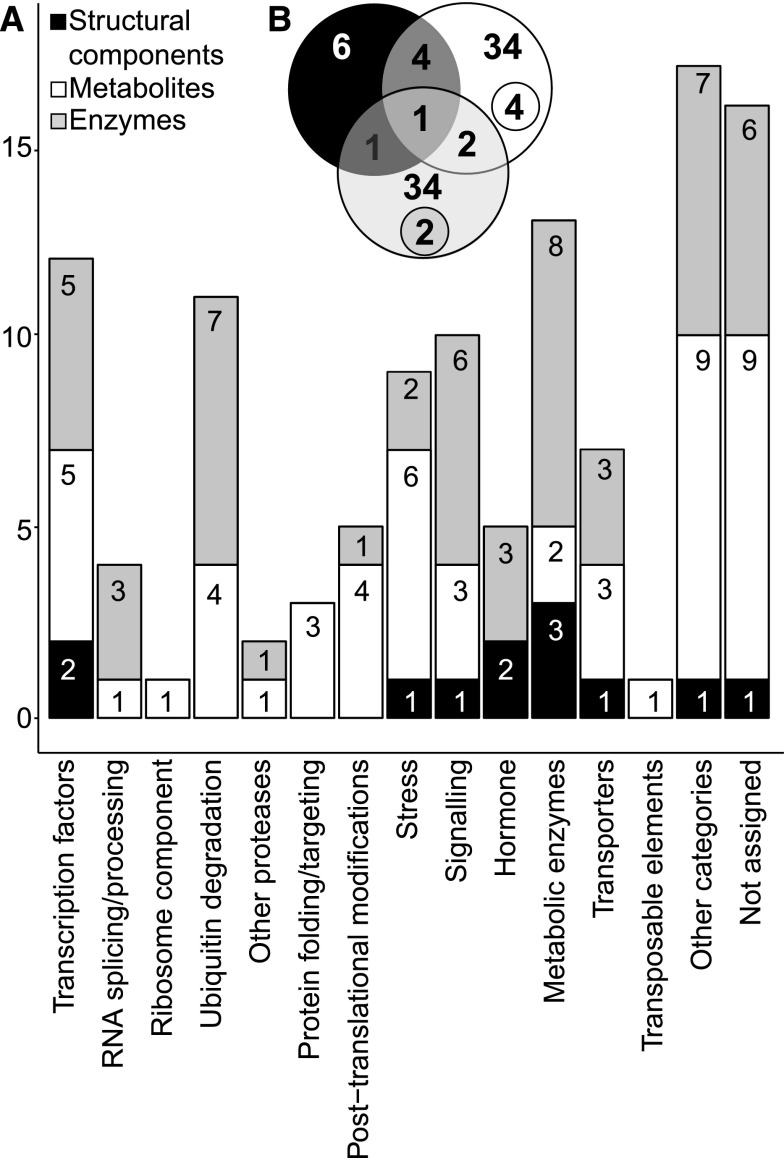
Figure 3.
Assignment of Candidate Genes to Functional Categories and Analysis of QTL Colocalization.
Candidate genes were selected based on the position of the SNP with the highest LOD score. QTL and QTL colocalization were determined by assessing LD between contiguous SNPs (within and between traits), with LOD ≥ 3.
(A) Number of genes falling in different ontology categories according to trait classes: structural components (black), metabolites (white), and enzyme activities (gray) (MapMan v3.5.1, http://mapman.gabipd.org; Thimm et al., 2004).
(B) Specific and colocalized QTL obtained for each trait class: structural components, metabolites, and enzyme activities. Colocalized QTL within a trait category are specified in smaller circles.

