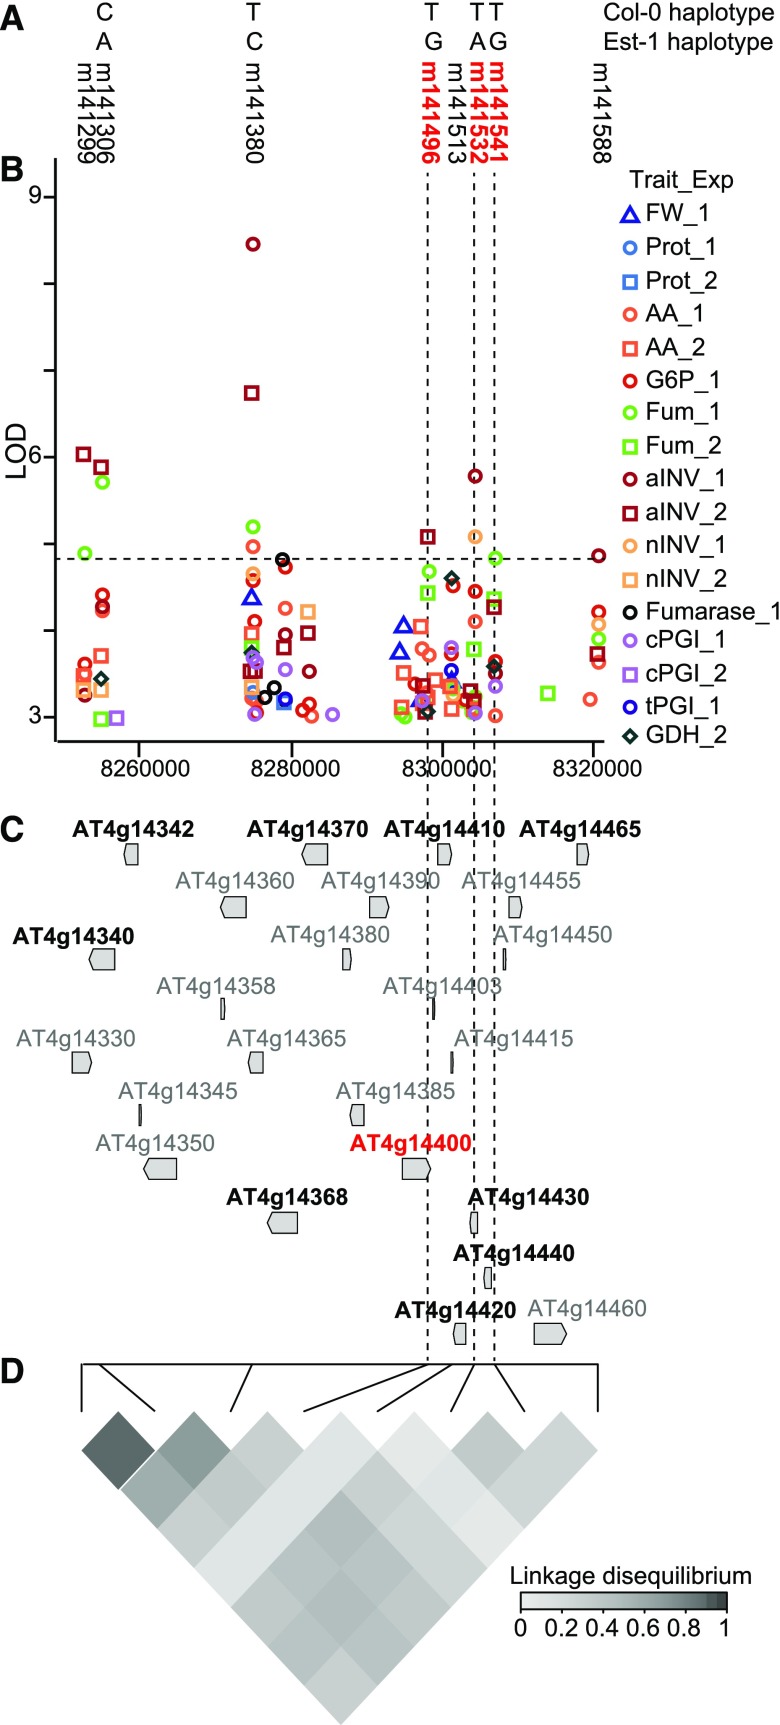
Figure 6.
Analysis of the Multitrait QTL on Chr4.
(A) Haplotypes for Col-0 and Est-1 obtained with the five SNPs in high LD on Chr4 (QTL 56; Table 2; Supplemental Data Set 5). The eight SNPs significantly associated (FDR < 0.1) with QTL 56 are shown. SNPs close to ACD6 are highlighted in red and marked along the figure with vertical black dashed lines.
(B) Manhattan plot for the 68.2 kb where the QTL 56 was detected for 11 traits. LOD ≥ 3 for different traits and different experiments are color- and symbol-coded (legend at right). The horizontal line shows FDR = 0.1 at LOD = 4.8.
(C) Genomic structure in the region covered by Chr4-QTL. Genes are scale-depicted with gray arrows indicating the orientation. AGI codes for candidate genes selected for validation are shown in black and ACD6 = AT4G14400 is shown in red.
(D) Heat map of LD between the eight SNPs called in (A) measured as the partial coefficient of correlation (R2, scale included in the panel).

