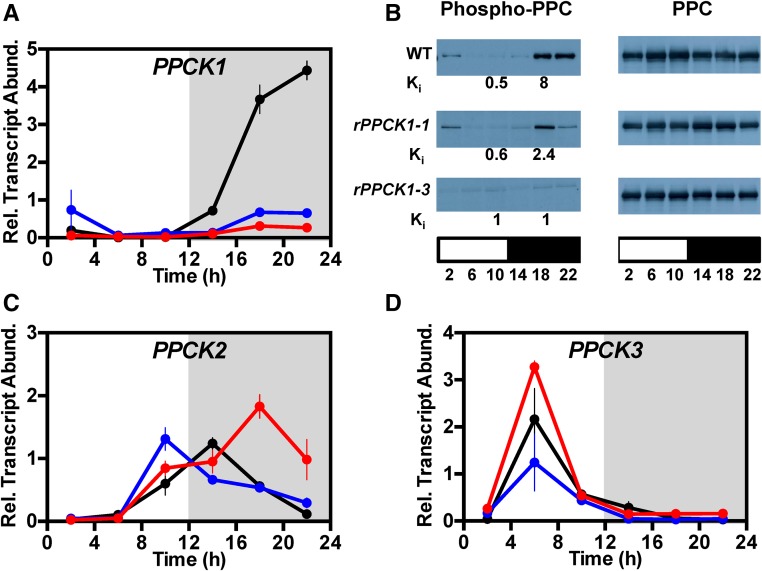
Figure 1.
Confirmation of Target Gene Silencing in Transgenic K. fedtschenkoi RNAi Lines rPPCK1-1 and rPPCK1-3.
Downregulation of the target endogenous KfPPCK1 gene was confirmed at the level of KfPPCK1 transcript abundance (A), and target protein PPC phosphorylation and the apparent Ki of PPC for l-malate in rapidly desalted leaf extracts, measured as l-malate (mM) required for a 50% reduction in extractable PPC activity (B). Gene transcript abundance was measured using RT-qPCR for the wild type, rPPCK1-1, and rPPCK1-3 for target genes: KfPPCK1 (A), KfPPCK2 (C), and KfPPCK3 (D). Mature leaves (leaf pair 6) were sampled from three individual, clonal, biological replicate plants collected every 4 h across the 12-h-light/12-h-dark cycle. A thioesterase/thiol ester dehydrase-isomerase superfamily gene (KfTEDI) was amplified from the same cDNAs as a reference gene. Gene transcript abundance data represent the mean of three technical replicates of each of three biological replicates and were normalized to reference gene KfTEDI; error bars represent the se of the mean calculated for each biological replicate. In all cases, plants were entrained under 12-h-light/12-h-dark cycles for 7 d prior to sampling. In (B), protein abundance (right panel) and the phosphorylation state of PPC (left panel) were determined by immunoblot analyses, and the apparent Ki of PPC for l-malate was measured using rapidly desalted leaf extracts (Ki values in mM below the corresponding left panel immunoblot time points). Total leaf protein (leaf pair 6) was isolated from leaves sampled every 4 h across the 12-h-light/12-h-dark cycle, separated using SDS-PAGE, and used for immunoblot analyses with antibodies raised to a phospho-PPC peptide (left panel). Sample loading was normalized according to total protein and confirmed using the immunoblot for total PPC protein, which is stable over the 12-h-light/12-h-dark cycle (right panel). The white bar below each panel represents the 12-h-light period, and the black bar below each panel represents the 12-h-dark period. For (A), (C), and (D), black data are for the wild type, blue for rPPCK1-1, and red for rPPCK1-3.

