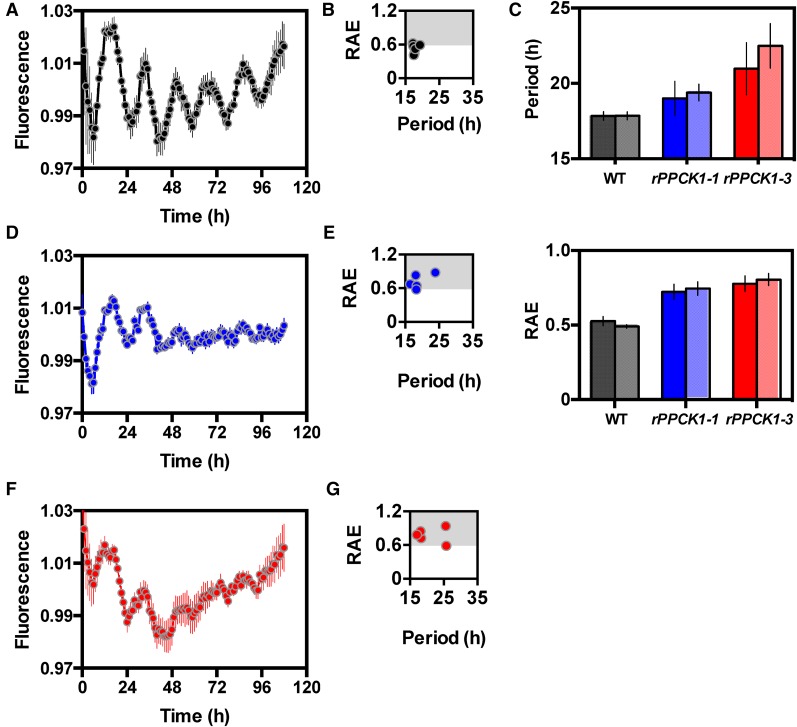
Figure 7.
DF Rhythms Collapsed toward Arrythmia in Lines rPPCK1-1 and rPPCK1-3.
Plants were entrained under 12-h-light/12-h-dark cycles before being transferred to constant red/ blue light under the CCD imaging camera (35 µmol m−2 s−1). DF was assayed with a 1-h time resolution for 108 h. The plots represent normalized averages for DF measured for six leaf discs sampled from three biological replicates of leaf pair 6 for each line. Error bars indicate se of the mean calculated from three biological replicates. Black data are for the wild type, blue data rPPCK1-1, and red data rPPCK1-3.
(A) Wild-type DF rhythm under LL.
(B) RAE plot for wild-type DF rhythm.
(C) Mean period length (upper graph) and RAE plots (lower graph) for the wild type (black/gray), rPPCK1-1 (blue/pale blue), and rPPCK1-3 (red/pale red); the plotted values were calculated using the Biodare package for circadian rhythm analysis. In both graphs, the dark shade of the color represents data from fast Fourier transform-nonlinear least squares analysis and the paler shade represents data from spectral resampling analysis.
(D) rPPCK1-1 DF rhythm.
(E) RAE plot for rPPCK1-1.
(F) rPPCK1-3 DF rhythm.
(G) RAE plot for rPPCK1-3.

