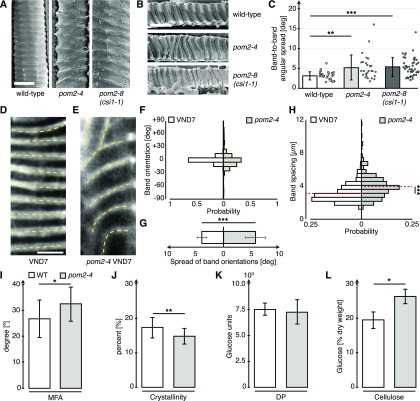
Figure 1.
Defects in CSI1/POM2 Cause Aberrant Xylem Vessel Patterns.
(A) and (B) Scanning electron micrographs of longitudinal sections of mature wild-type stems. Exposed (A) and transected (B) xylem vessels of wild-type plants and pom2-4 and pom2-8 (csi1-1) mutants. Bar = 10 µm.
(C) Band-to-band orientations in pom2-4 (16 cells in 6 seedlings) and pom2-8 (44 cells in 6 seedlings) compared with wild-type xylem (27 cells in 6 seedlings) obtained from the images in (A) and (B).
(D) and (E) S4B staining of cellulose in VND7-induced hypocotyls. Dotted lines indicate highly ordered bands in the secondary walls of wild-type cells (D) and irregular bands in pom2-4 mutant cells (E). Bar = 5 μm.
(F) Distribution of the average band orientations (yellow lines in [A] and [B]).
(G) The spread of band orientations within individual cells of induced pom2-4 cells (602 bands in 115 cells in 5 seedlings) compared with wild-type cells (824 bands in 132 cells in 5 seedlings).
(H) Secondary wall band spacing in the pom2-4 mutant compared with wild-type cells.
(I) MFA (relative to growth axis) in the pom2-4 mutant compared with the wild type.
(J) Cell wall crystallinity in the pom2-4 mutant compared with the wild type.
(K) Degree of polymerization (DP) in the pom2-4 mutant compared with the wild type.
(L) Cellulose content (% fraction of dry weight) in the pom2-4 mutant compared with the wild type. All measurements ([I] to [L]) were done on ground stems of 10-week-old, fully senesced plants grown in 16-h-light/8-h-dark conditions. Data are means ± sd. Statistical significance was tested by Welch’s unpaired t test: *P < 0.05, **P < 0.005, and ***P < 0.0005.

