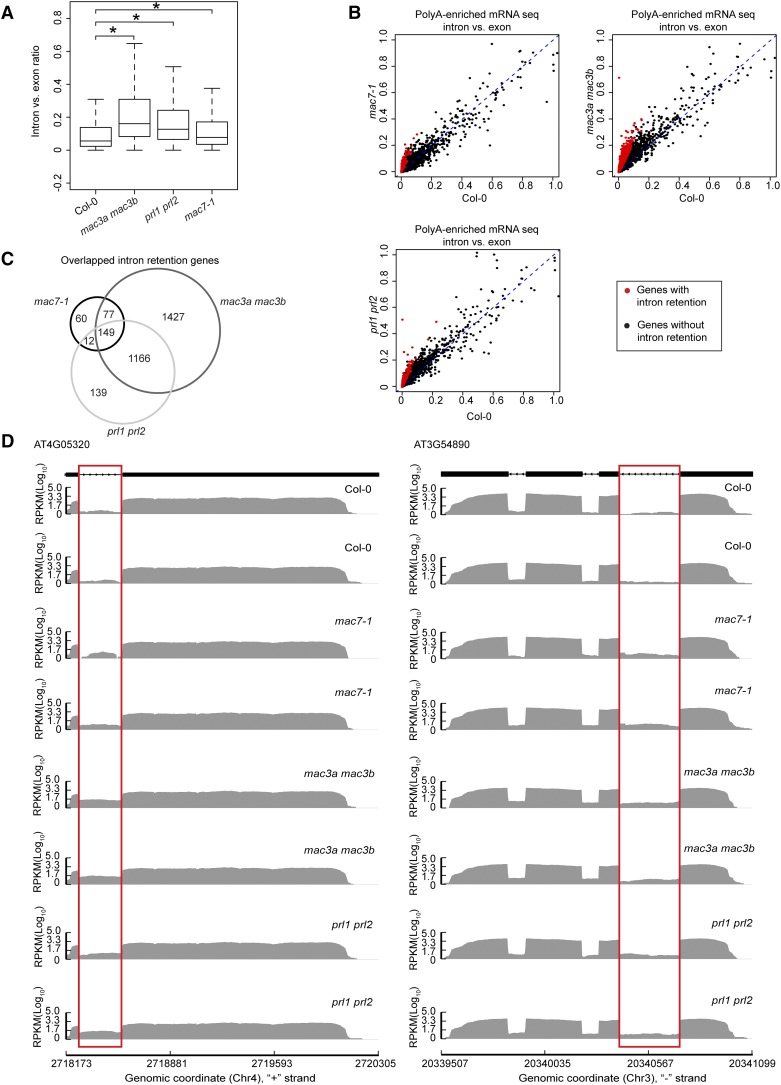
Figure 8.
MAC Subunits Affect pre-mRNA Splicing.
(A) Box plot of intron/exon ratios in the indicated genotypes. All genes that pass an abundance filter in expression were included in this analysis. Asterisks indicate significant difference between the mutant and the wild type (Col-0) (Wilcoxon test, P < 2.2e-16).
(B) The intron/exon ratio per gene in Col-0 versus the indicated mutants. Black dots represent all genes with raw intronic read number ≥ 2, exonic read number ≥ 5, and final intron/exon ratio between 0 and 1. Red dots represent genes with significantly higher intron/exon ratio relative to the wild type (fold change ≥ 2 and false discovery rate < 0.01).
(C) A Venn diagram showing the degree of overlap among genes with intron retention defects in mac7-1, mac3a mac3b, and prl1 prl2.
(D) Examples of genes with intron retention defects. RPKM, reads per kilobase per million mapped reads. Two biological replicates for each genotype are shown. The rectangles mark introns with higher retention in the mutants.

