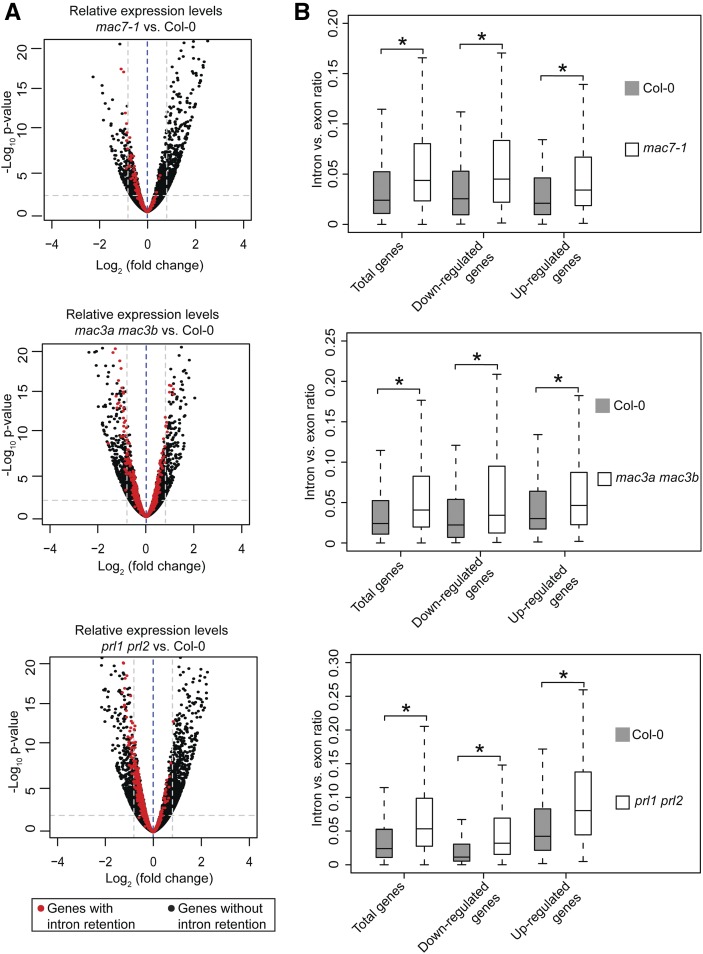
Figure 9.
MAC Affects pre-mRNA Splicing and Gene Expression Independently.
(A) Volcano plots illustrating fold changes of gene expression levels in the indicated mutants compared with Col-0. Thresholds for fold change of 1.5 and P ≤ 0.01 are shown in the plots as gray dashed lines. Black dots and red dots represent the same genes as in Figure 8B.
(B) Box plots of intron/exon ratios in total, upregulated, and downregulated genes in the indicated genotypes. Only genes that pass an abundance filter (raw intronic read number ≥ 2 and exonic read number ≥ 5) were included in this analysis. Asterisks indicate significant difference between the mutant and the wild type (Col-0) (Wilcoxon test, P < 2.2e-16).

