Figure 4.
The SCD Complex Colocalizes in Vivo and Associates in Vitro with SEC15B.
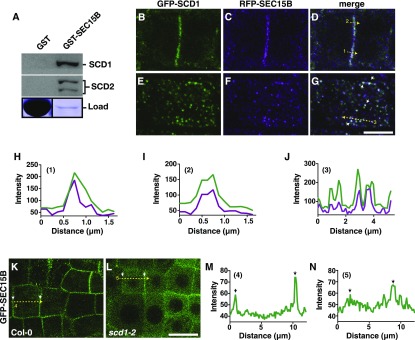
(A) GST-SEC15B was incubated with Arabidopsis cell extract, and binding of candidate proteins was determined by immunoblot (top panel) analysis with indicated antibodies. Lower panel: Coomassie-stained SDS-PAGE of GST and GST-fusion protein load used in the binding experiment.
(B) to (D) CLSM images of a dividing root cell expressing GFP-SCD1 and RFP-SEC15B show colocalization at the cell plate (Costes P value, 1.00; Pearson’s R value, 0.65).
(E) to (G) GFP-SCD1 and RFP-SEC15B colocalize at distinct punctae in root cells. Arrowheads denote colocalization at distinct punctae (Costes P value, 1.00; Pearson’s R value, 0.61). Bar = 5 µm.
(H) and (I) Line scan measurements (1 and 2 respectively, yellow dotted arrows) of CLSM image (D) are plotted to show overlapping intensity profiles.
(J) Line scan measurement (yellow dotted arrow 3) of CLSM image in (G) plotted to show overlapping intensity profiles.
(K) and (L) CLSM images of GFP-SEC15B localization in wild-type (Col-0) and scd1-2 mutant plant roots. Bar = 10 µm. Arrowheads denote the plasma membrane.
(M) and (N) Line scan measurements (4 and 5 respectively, yellow dotted arrows) of CLSM images ([K] and [L]) are plotted to show intensity profiles. Arrowheads denote the plasma membrane.

