Figure 5.
Comparison of ALMT4- and ALMT9-Mediated Currents.
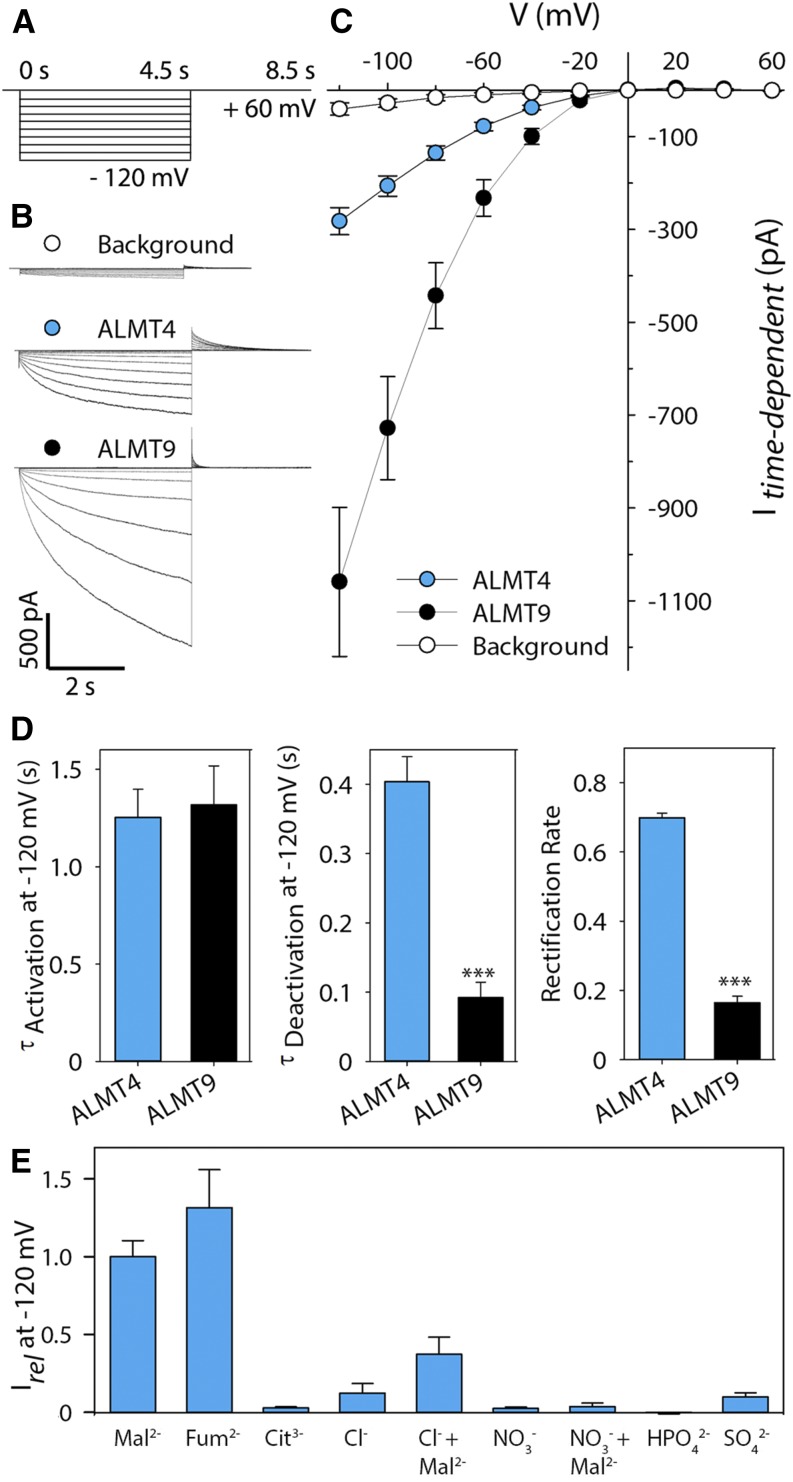
(A) Schematic representation of the voltage protocol used. Activating currents were evoked by successive voltage pulses ranging from a holding voltage of +60 mV to −120 mV and recorded for 4.5 s, with successive voltage pulses increasing by 20 mV. Deactivating tail currents were recorded for 4 s by a subsequent step to holding voltage.
(B) Representative current traces of background current from untransformed vacuoles (top, white), ALMT4 (middle, blue), and ALMT9 (bottom, black).
(C) I-V curve of background (white circles, n = 11), ALMT4 (blue circles, n = 11), and ALMT9 (black circles, n = 12) time-dependent currents at steady state in symmetric Mal2− conditions (100 mM Mal2−vac/100 mM Mal2−cyt). Currents were measured on excised outside-out patches of N. benthamiana vacuoles, either untransformed or confirmed to express ALMT9-GFP or ALMT4-GFP. Data points are means of current means at steady state. Error bars denote the se.
(D) Time constants for activating (left) and deactivating (middle) time-dependent current at −120 mV and rectification rate (right). For analysis methods, see Supplemental Figure 5 and Methods. Data are means ± se.
(E) Current means for different substrates relative to Mal2− current at −120 mV (n = 3) ± se. In case of Cl− and NO3−, 1 mM Mal2− was added to investigate potential current activation.

