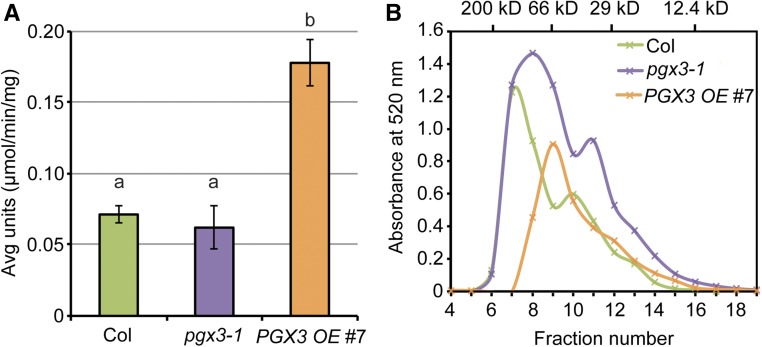
Figure 8.
Changes in PGX3 Expression Level Lead to Altered Total PG Activity and HG Molecular Mass.
(A) Total PG activity in vivo is significantly higher in PGX3 OE #7 plants. Total plant proteins were isolated from 33-d-old flowers. One unit of PG activity is the amount of enzyme releasing 1 µmol reducing end group per min per mg total protein at 30°C. Error bars are se, and lowercase letters represent significantly different groups (n ≥ 3 technical replicates per genotype per biological replicate, two biological replicates, and each biological replicate is an independent pool of flowers; P < 0.05, one-way ANOVA and Tukey test).
(B) Molecular mass analysis of CDTA-soluble pectins extracted from 34-d-old Col, pgx3-1, and PGX3 OE #7 rosette leaves. Molecular mass of the standards (β-amylase, 200 kD; BSA, 66 kD; carbonic anhydrase, 29 kD; and cytochrome c, 12.4 kD) is shown on the x axis at the top (n = 2 technical replicates per genotype per biological replicate, two biological replicates, and each biological replicate is an independent pool of rosette leaves).

