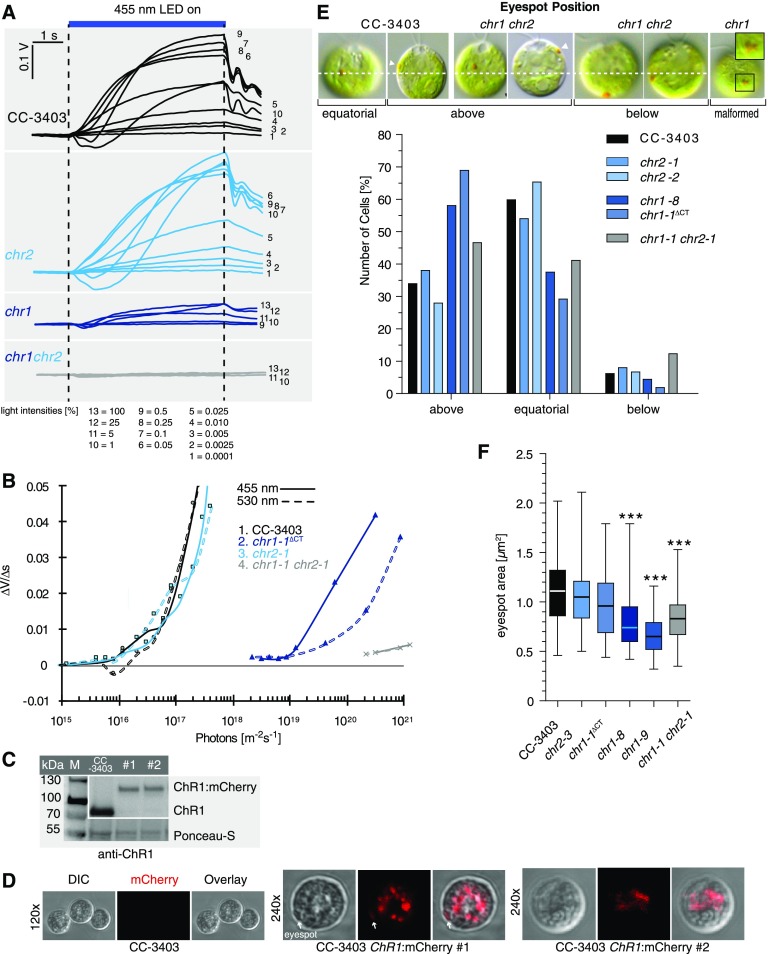
Figure 4.
Physiological Analysis of ChR1 and ChR2 Disruption Strains.
(A) Light-scattering assay of strains as indicated. Phototactic responses to different intensities of blue light (455 nm). The 100% light corresponds to 1.25 × 10²¹ photons m−2 s−1. Numbers below correspond to the various light intensities employed.
(B) Phototactic sensitivity of various Chlamydomonas lines. Initial linear slopes of the light-scattering responses at 455 nm (solid lines) and 530 nm (dashed lines) were calculated (∆V/∆s) for CC-3403 cells and cells containing chr1, chr2, or chr1 chr2 modifications and plotted against the normalized light intensity.
(C) Protein immunoblotting of two CC-3403 strains with mCherry inserted into ChR1 (#1; #2). Anti-ChR1 antibodies detected ChR1:mCherry (∼110 kD) fusion protein. M, marker; WT, CC-3403 crude extracts. Ponceau staining was used as a loading control.
(D) Confocal microscopy: Live-cell imaging of CC-3403 ChR1:mCherry strains. CC-3403 was used as a control. ChR1:mCherry is mainly located within the cell cytoplasm. Only minor fractions are found within the plasma membrane region of the eyespot (white arrow). The same settings and filters were used in all images. DIC, differential interference contrast.
(E) Eyespot position. DIC images of the indicated ChR1 and ChR2 disruption strains are shown at the top. Dashed line indicates equatorial position and arrowheads the eyespot. For statistical analysis, between 100 and 193 cells of each strain grown under identical conditions were analyzed.
(F) Box plot (whiskers min to max) of the eyespot area of the indicated strains. ANOVA analyses with Tukey's multiple comparison post-test revealed a significant difference (***P < 0.001; Supplemental Table 9) for the marked strains compared with other strains. n = 62 to 65 cells.

