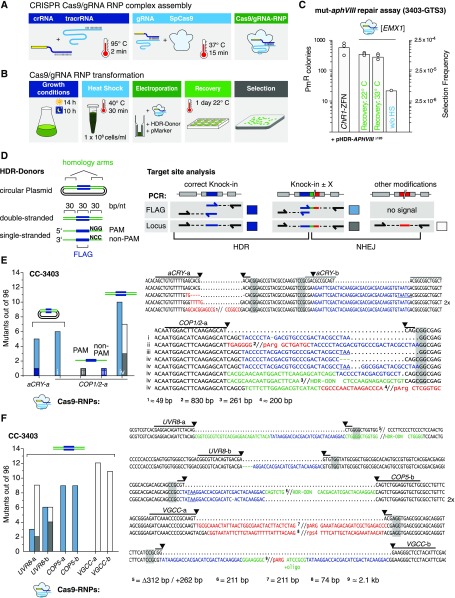
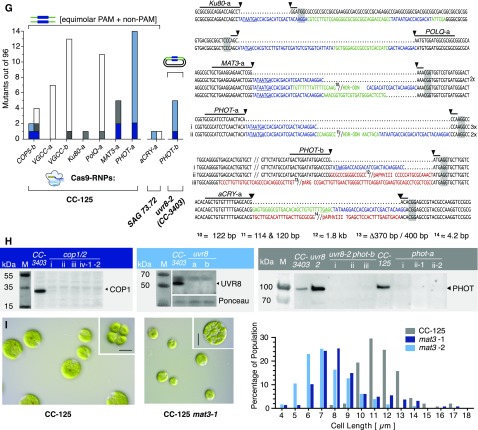
Figure 6.
Gene Targeting Using Exogenously Supplied Recombinant Cas9/gRNA RNP Complexes.
(A) Schematic illustrating Cas9/gRNA RNP assembly detailed in Methods.
(B) Schematic workflow of the Cas9/gRNA RNP transformation procedure.
(C) Number of PmR colonies obtained with the GTS mut-aphVIII repair assay from three independent transformations. Strain 3403-GTS3, with mut-aphVIII [EMX1] and [ChR1] target sites, was transformed with HDR donor plasmids (pHDR-APHVIII∆120) and either ChR1-ZFN plasmids or Cas9/gRNA[EMX1] RNP. Selection frequency is calculated as PmR colonies/electroporated cells. The experiments were performed as depicted in (A) and (B) except where indicated. Controls without heat shock before transformation (without HS).
(D) Left: HDR donors contain a 30-bp target site insertion sequence (blue box, “FLAG”) surrounded by two target gene homology arms (equal length, square brackets). Right: Possible mutations and underlying repair mechanisms are drawn schematically. Arrows indicate ODN bindings sites used during PCR analysis. Colored boxes are mutation variants and refer to color-coded sequences in (E) to (G), and squares indicate the type of modification: dark blue, HDR on both sides; light blue, single side HDR detected by flag-PCR; dark gray, single side HDR detected by locus PCR; open square, dual side NHEJ detected by locus PCR.
(E) to (G) Left: number of identified mutants (out of 96 tested). The target site, HDR donor, and strain are indicated for each experiment. Cells were cotransformed with a selection marker (ARG7 for CC-3403, aphVII for CC-125, and aphVIII for 3403-uvr8). Sequence alignment of target site amplicons from mutant strains with the corresponding wild-type sequence. Lines indicate 20-bp gRNA binding sites. Predicted cutting sites are shown (black arrowheads), and NGG PAM sequences are highlighted by gray boxes. Gaps are marked with dots, deletions with minus signs. FLAG sequences are shown in blue, HDR donor sequences inserted in a non-HDR manner are shown in green, and other inserting DNA e.g., genomic DNA fragments or DNA from marker plasmids, are shown in red. Premature STOP codons are underlined.
(H) Protein immunoblotting using protein-specific antisera and anti-rabbit HRP-conjugated secondary antibodies for chemiluminescent visualization. Left: Immunoblotting of cop1 mutants obtained in (E), i to iv, anti-VOP rabbit antiserum, 1:2000; middle: uvr8 mutants described in (F), anti-UVR8 rabbit antiserum, 1:2000; right: phot mutants described in (G), i to iii, anti-LOV1 rabbit antiserum, 1:2000. M, marker.
(I) Left: DIC images of unfixed CC-125 and CC-125 mat3-1 cells and division clusters (upper right corner). Right: cell size distribution of CC-125 (n = 167 cells), CC-125 mat3-1 (n = 170 cells), and CC-125 mat3-2 (n = 136 cells). Bars = 10 µm.


