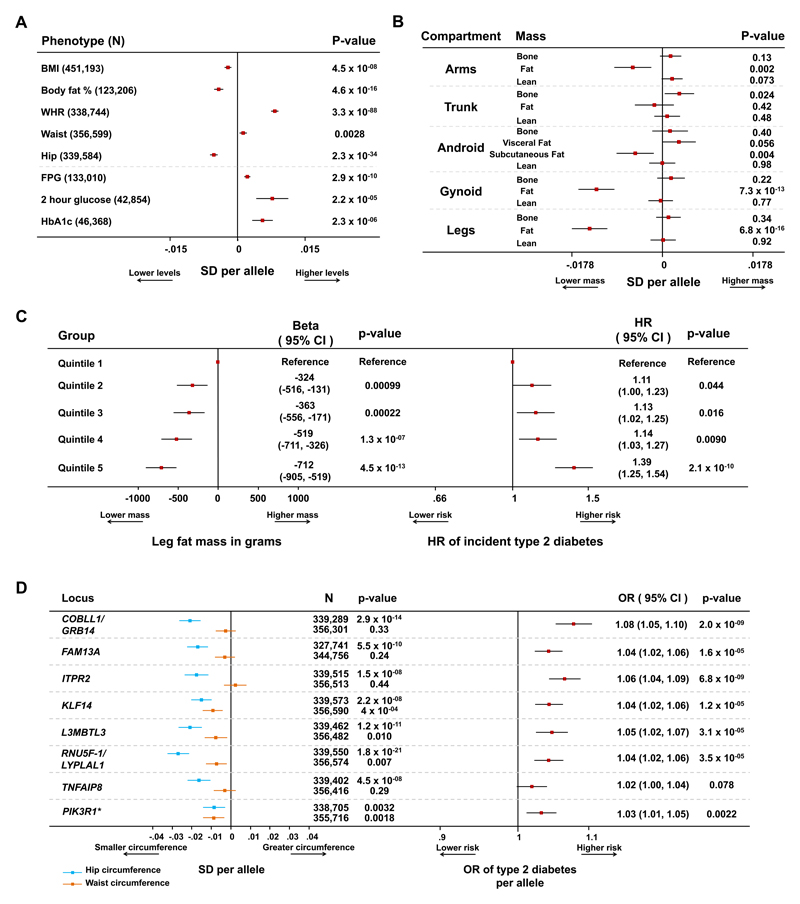
Figure 1. Combined associations with detailed anthropometry and metabolic disease risk at the 53 genomic loci.
Panel A: association of the 53-SNP genetic score with anthropometric and glycaemic traits in meta-analyses of genetic association studies. Body mass index (BMI), waist-to-hip ratio (WHR), waist and hip circumference data are from the GIANT consortium and the UK Biobank study. Body fat percentage data are from the UK Biobank, EPIC-Norfolk and Fenland studies. Fasting plasma glucose (FPG), 2 hour glucose and HbA1c data are from the MAGIC consortium. Squares with error bars represent the per-allele beta coefficients in standard deviation units and their 95% confidence intervals. Panel B: association of genetic scores with compartmental body masses. Data are from 12,848 participants of the Fenland and EPIC-Norfolk studies who underwent a DEXA scan. Squares with error bars represent the per-allele beta coefficients in standard deviation units and their 95% confidence intervals. Panel C: association with lower levels of leg fat mass and higher hazard of incident type 2 diabetes by quintiles of the 53-SNP genetic risk scores. Associations are reported for individuals in the exposed category compared with the bottom quintile (reference category). Associations with leg fat mass are from 9,747 participants of the Fenland study and are reported on the left. Associations with incident type 2 diabetes are from 7,420 incident cases and 9,267 controls of the InterAct study and are reported on the right. Squares represent the beta coefficients in grams of leg fat mass (left plot) or the hazard ratio (HR) for incident type 2 diabetes (right plot) in each category compared with the lowest quintile. Error bars represent the 95% confidence intervals of these estimates. Panel D: associations of individual lead SNPs at eight loci with waist, hip circumference (left) and type 2 diabetes (right). Loci were selected on the basis of their genome-wide significant association with hip circumference or body fat percentage (i.e. PIK3R1). Waist and hip circumference analyses are from a meta-analysis of the GIANT and UK Biobank studies. Type 2 diabetes analyses are from a meta-analysis of the DIAGRAM, InterAct and UK Biobank studies. Squares with error bars represent the per-allele beta coefficients in standard deviation units of waist and hip circumference (left plot) or the per-allele odds ratio (OR) of type 2 diabetes (right plot). Error bars represent the 95% confidence intervals of these estimates. *Detailed associations at the PIK3R1 locus, which was primarily associated with lower body fat percentage, are presented in Supplementary Figure 9.

