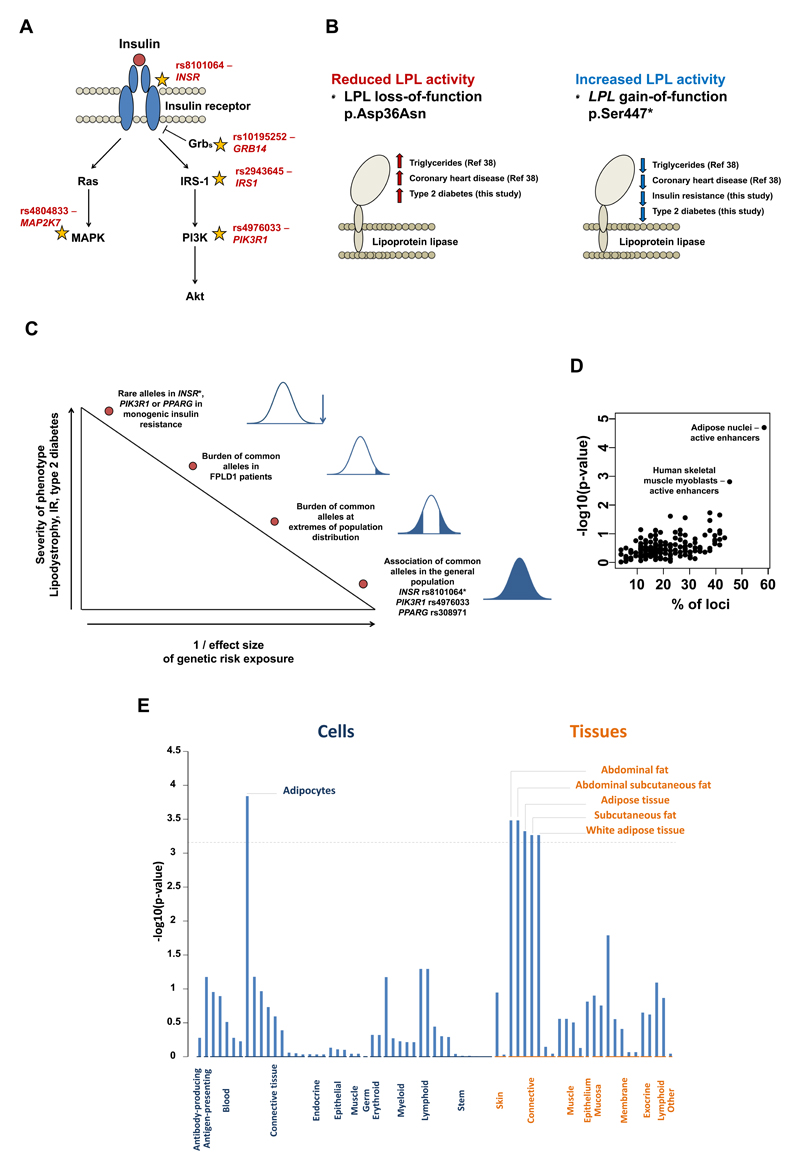
Figure 3. Putative effector genes, tissues and cell types.
Panel A: schematic representation of some established components of the insulin signalling pathway with stars reporting the location in the pathway of putative effector genes, with their respective lead single nucleotide polymorphism listed. Panel B: associations of gain- and loss-of-function genetic variants in the LPL gene with type 2 diabetes. The reference number in parenthesis refers to the study reporting the association with triglycerides and coronary heart disease (see reference number 38 of this manuscript).38 Panel C: summary of evidence about links between genetic variants, lipodystrophy, insulin resistance, and type 2 diabetes at different levels of the population phenotypic distribution. *Rare syndromes caused by autosomal dominant INSR mutations are not usually associated with lipodystrophy and the INSR rs8101064 polymorphism is not associated with body fat percentage. Panel D: overlap of the 53 loci (lead SNPs plus proxy variants in r2>0.8) with chromatin state annotations from the NIH Roadmap. Panel E: DEPICT’s annotation of cell types and tissues on the basis of expression patterns in 37,427 human microarray samples. The y-axis represents the –log10(p-value) for enrichment of signal in a cell or tissue type attributed by DEPICT. The horizontal broken line represents the multiple-test corrected threshold of statistical significance (Bonferroni p=0.00072).

