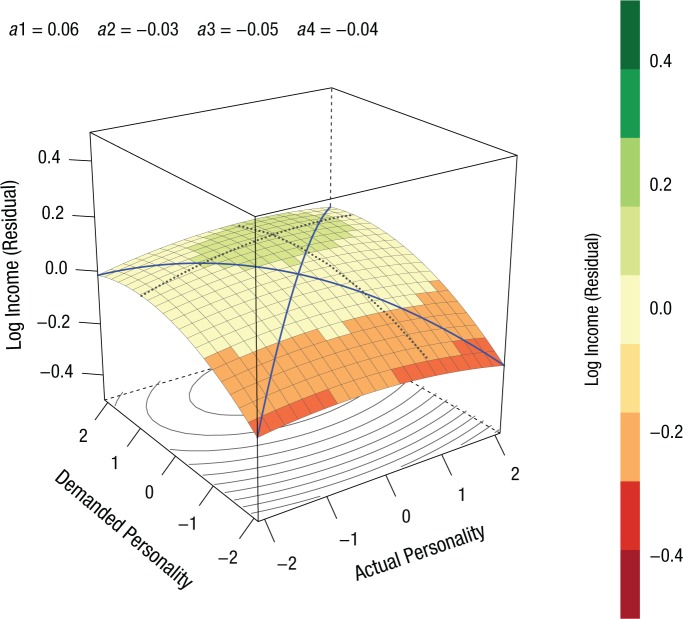
Fig. 2.
Response surface indicating the association between income (vertical axis) and combinations of jobholders’ actual openness to experience and their jobs’ demands for openness to experience (the horizontal base). The shape of this response surface within this three-dimensional space is described by four statistical coefficients (a1–a4), whose values are shown at the top of the graph. The colors on the surface correspond to log-transformed, residualized income values, as indicated on the color key to the right. The note to Table 2 explains how to interpret these coefficients. The blue lines running across the surface are the line of congruence (front to back) and the line of incongruence (left to right).

