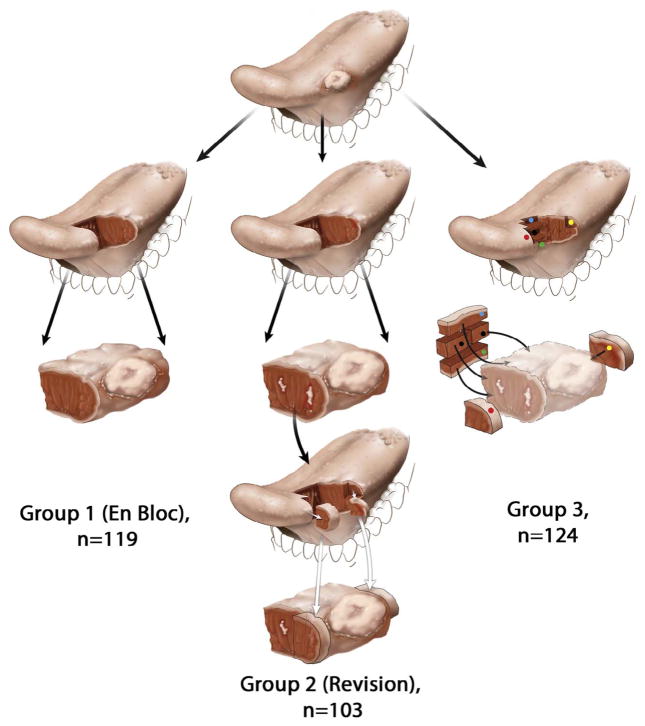
Fig. 1.
Schematic representation of the glossectomy workflow. For simplicity, a predominantly exophytic tumor at the lateral edge of the oral tongue is illustrated, with the row representing the next step in the workflow. In Group 1 (left column), tumor bed margins were not sampled. In Group 2 (middle column), margins were examined from the glossectomy specimen and found to be positive or otherwise suboptimal. The surgeon revised margins by obtaining additional tissue from the tumor bed. White irregular areas in the anterior aspect of glossectomy specimen represent residual carcinoma at the initial anterior margin (third row). The surgeon revised anterior margin by obtaining additional tissue from the tumor bed, representing a new anterior margin (fourth row). To imagine the relationship between the actual glossectomy margins and additional tissue, the two types of margins are superimposed in the fifth row. Due to the challenges of relocating the exact aspect of the relevant anterior margin in the tumor bed, size discrepancy, and uncertain orientation of the additional tissue, it is conceivable that in some cases the revised margin may not actually cover the entire residual tumor at the anterior glossectomy margin. In Group 3 (right column), five margins are primarily sampled from the tumor bed (red, green, yellow, blue, and black dots), without prior examination of the glossectomy specimen (displayed in lighter colors in the third row) by the pathologist.

