
Fig. 3. Retroviral integration sites and enriched histone H3K4me1 at enhancer E9; correlation with active MEIS1 expression in acute myeloid leukemia cells.
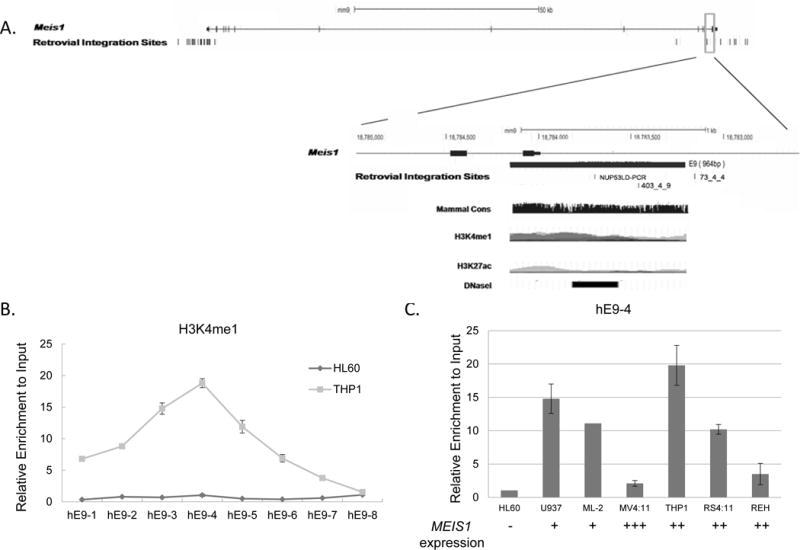
A). Retroviral integration sites in the mouse Meis1 gene. The 3′ region of the mouse Meis1 gene (UCSC genomic browser, NCBI36/mm9, chr11:18,780,325-18,786,183) is enlarged. The genomic location of the predicted enhancer E9 is marked in the gene structure as a black solid box. The open boxes below the gene structure represent the four genomic sequences recovered from the integration sites in individual leukemia mouse clones (data obtained from Retrovirus Tagged Cancer Gene Database). Retroviral integration site of clone NUP53LD PCR and 403_4_9 are located within the enhancer E9, whereas clone 73_4_4 is only 52bp away from enhancer E9. The DNA sequence of the enhancer E9 is aligned with the human MEIS1 genomic region in UCSC genomic browser. Histone modifications of H3K4me1, H3K4me3 and H3K27ac are the ChIP seq results from the H1-hESC, K562, and GM12878 cells in the UCSC genomic browser, and the DNase I HS (ENCODE project) and the mammalian conservation is presented for the enhancer element E9 region.
B, C). Histone H3K4me1 at enhancer E9 is associated with MEIS1 activation. Crosslinked chromatin from THP-1(rectangle) and HL-60 (open circle) were immunoprecipitated with antibodies against H3K4me1, a marker for potential enhancers. The precipitated DNA was amplified using 8 primer pairs (hE9-1 to hE9-8) spanning the 2.1 Kb enhancer E9. Open bars are HL60 cells, and grey bars are THP1 cells. Data are shown as fold change versus input DNA. C) Crosslinked chromatin was immunoprecipitated with antibodies against H3K4me1 in multiple leukemic cell lines. The precipitated DNA was amplified using primer hE9-4. Data are shown as fold change versus input DNA. The mRNA expression level of each cell line is marked under the each column, and were shown as the “-, +, ++, +++”, representing negative, or a graded relative expression level.