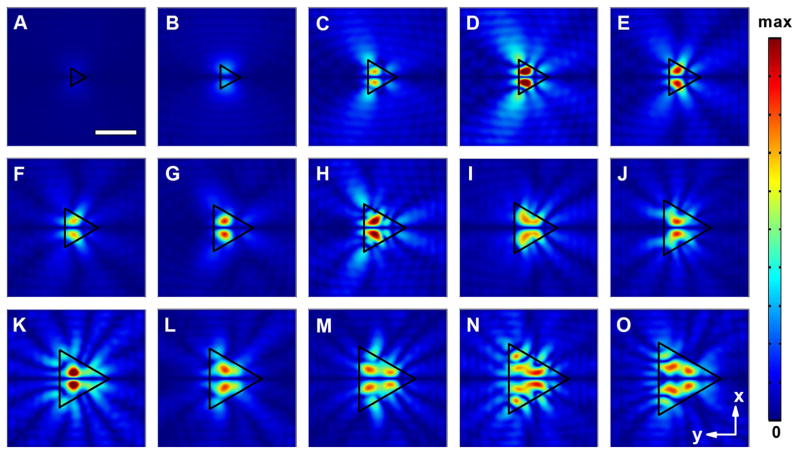
Fig. 4.
Normalized 2D absolute pressure field distribution (Abs(P)) at the center cross section of the microfluidic chamber for triangular acoustofluidic waveguides with different diameters of their circumcircles (D). a D = 150 μm; b D = 200 μm; c D = 280 μm; d D = 290 μm; e D = 300 μm; f D = 320 μm; g D = 380 μm; h D = 400 μm; i D = 420 μm; j D = 460 μm; k D = 480 μm; l D = 500 μm; m D = 540 μm; n D = 580 μm; o D = 600 μm (Movie 3). Scale bar: 300 μm. The boundary of the waveguide region is highlighted using a black triangle. Pressure nodes and pressure antinodes are shown with different field intensities. The corresponding 3D pressure field distributions for typical waveguides are shown in Supplementary Fig. 3

