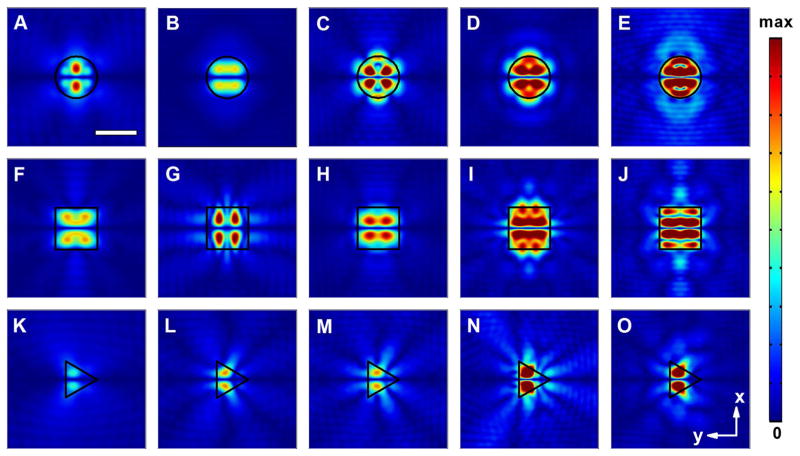
Fig. 5.
Normalized 2D absolute pressure field distribution (Abs(P)) at the center cross section of the microfluidic chamber for acoustofluidic waveguides at different excitation frequencies. a–e Circular acoustofluidic waveguides (300 μm in diameter): a 12 MHz; b 14 MHz; c 16 MHz; d 18 MHz; e 20 MHz (Movie 4); f–j square acoustofluidic waveguides (width of 300 μm): f 12 MHz; g 14 MHz; h 16 MHz; i 18 MHz; j 20 MHz (Movie 5); k–o: triangular acoustofluidic waveguides (diameter of the circumcircle as 300 μm): k 12 MHz; l 14 MHz; m 16 MHz; n 18 MHz; o 20 MHz (Movie 6). Scale bar: 300 μm. The boundary of the waveguide region is highlighted using black lines. Pressure nodes and pressure antinodes are shown with different field intensities. The corresponding 2D pressure field distributions within the x–z plane and 3D pressure field profiles for typical waveguides are shown in Supplementary Fig. 4 and Supplementary Fig. 5, respectively

