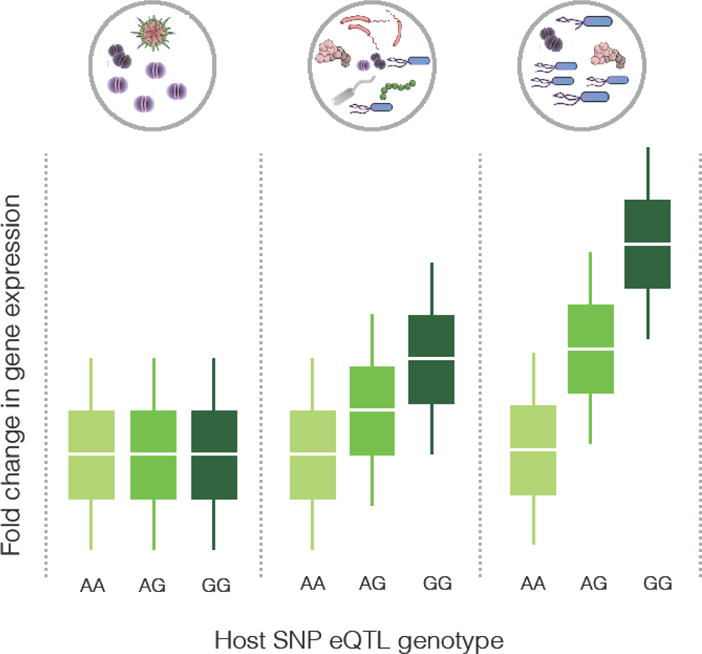
Figure 3.

An illustration of interaction between microbiome and host eQTL in regulating a hypothetical gene. The gene’s expression level is shown on the y-axis, and the genotype at the eQTL is on the x-axis. The three panels correspond to three microbiome compositions, with the lowest abundance of the causal microbe on the left, and the highest on the right.
