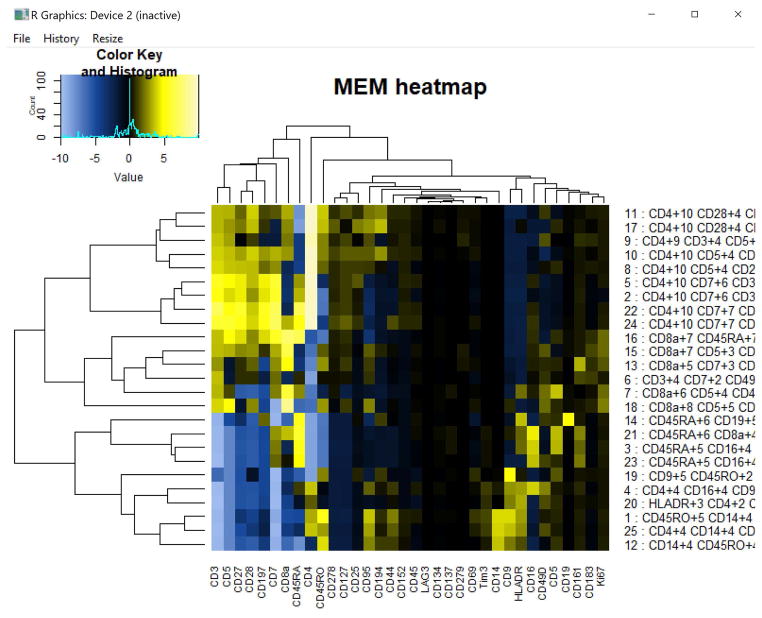
Figure 11. MEM heatmap of 25 clusters from melanoma patient blood.
Hierarchically clustered MEM scores of 25 cell clusters from melanoma patient blood. Dendrograms are displayed on the rows and columns, and the MEM labels (marker and respective enrichment score) are displayed as row names. When these row names are cut off, as they are above, they can be viewed in the output files folder in the “enrichment score- row names” file or by saving the heatmap as a PDF file and opening it in Adobe Illustrator or other editing programs.

