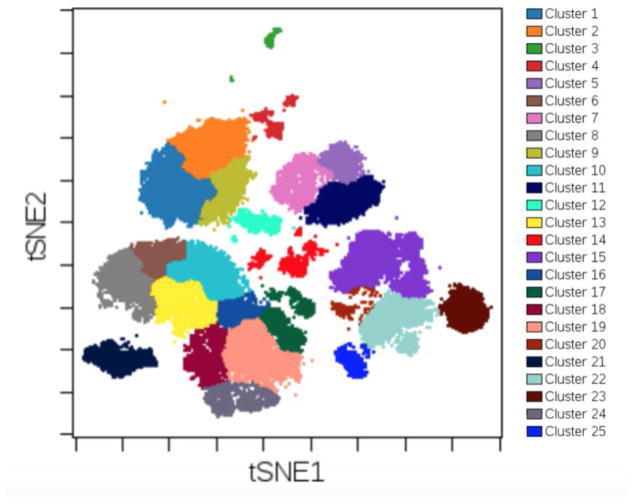
Figure 15. Plot t-SNE axes and view FlowSOM clusters as the overlaid dimension.
FlowSOM clusters can be displayed on top of the t-SNE axes on which FlowSOM clustered. This method can be used to visually check whether or not the clustering captures expected populations of cells. The number of clusters and other FlowSOM parameters can then be adjusted to optimize the clustering.

