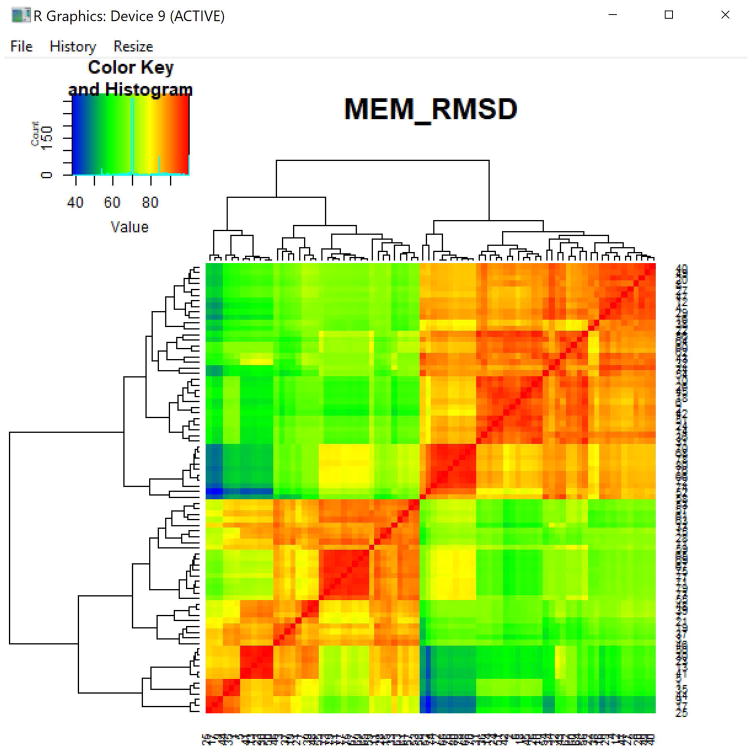
Figure 16. MEM RMSD heatmap from population files.
Percent maximum RMSD between CD4+ T cells and B cells across multiple experiments, tissues, and platforms. Each pair of populations was compared using their common markers for the RMSD calculation. The row and column numbers correspond to the file order in the folder.

