Fig. 3.
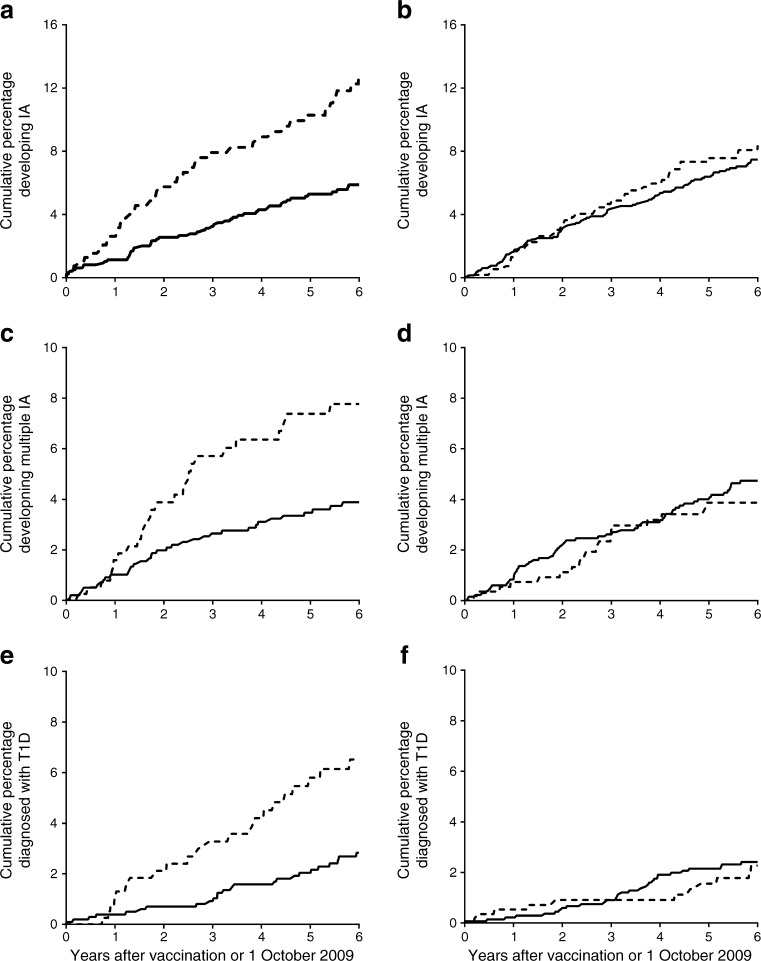
Kaplan–Meier curves showing the cumulative percentage of vaccinated (solid line) and unvaccinated (dashed line) children developing islet autoantibodies (IA) in (a) Finland with an average follow-up time of 5.3 years for vaccinated (n = 976) and 4.7 years for unvaccinated (n = 397) children and (b) Sweden with an average follow-up time of 5.4 years for vaccinated (n = 1309) and 5.0 years for unvaccinated (n = 563) children; multiple islet autoantibodies in (c) Finland with an average follow-up time of 5.3 years for vaccinated (n = 1000) and 4.8 years for unvaccinated (n = 400) children and (d) Sweden with an average follow-up time of 5.5 years for vaccinated (n = 1347) and 5.2 years for unvaccinated (n = 569) children. Type 1 diabetes (T1D) in (e) Finland with an average follow-up time of 5.5 years for vaccinated (n = 1027) and 5.1 years for unvaccinated (n = 410) children and (f) Sweden with an average follow-up time of 5.7 years for vaccinated (n = 1384) and 5.4 years for unvaccinated (n = 578) children, after the child was vaccinated or after 1 October 2009 for the children who were not vaccinated

