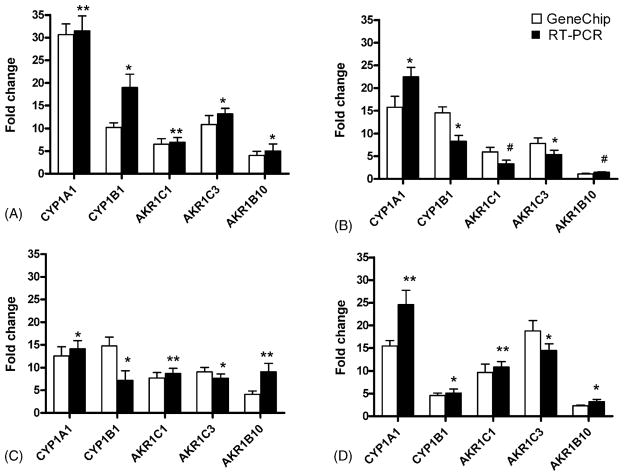
Fig. 4.
Comparative quantitative real-time RT-PCR analysis. RNA from control (0 h) and treated (24 h, 25 μg/ml CSC) cells were subjected to quantitative real-time RT-PCR analysis using primers specific for CYP1A1, CYP1B1, AKR1C1, AKR1C3, AKR1B10, and the internal standard β-actin. (A) NHEK; (B) Leuk1; (C) Leuk2; (D) 101A cells; open bars, microarray data; solid bars, RT-PCR data. The fold change levels on the Y-axis are relative to the expression in untreated cells. Results are expressed as the mean and range of duplicate determinations for microarray data, and as mean ± S.D. of four independent experiments for qRT-PCR data: *p < 0.05; **p = 0.01; #non-significant.

