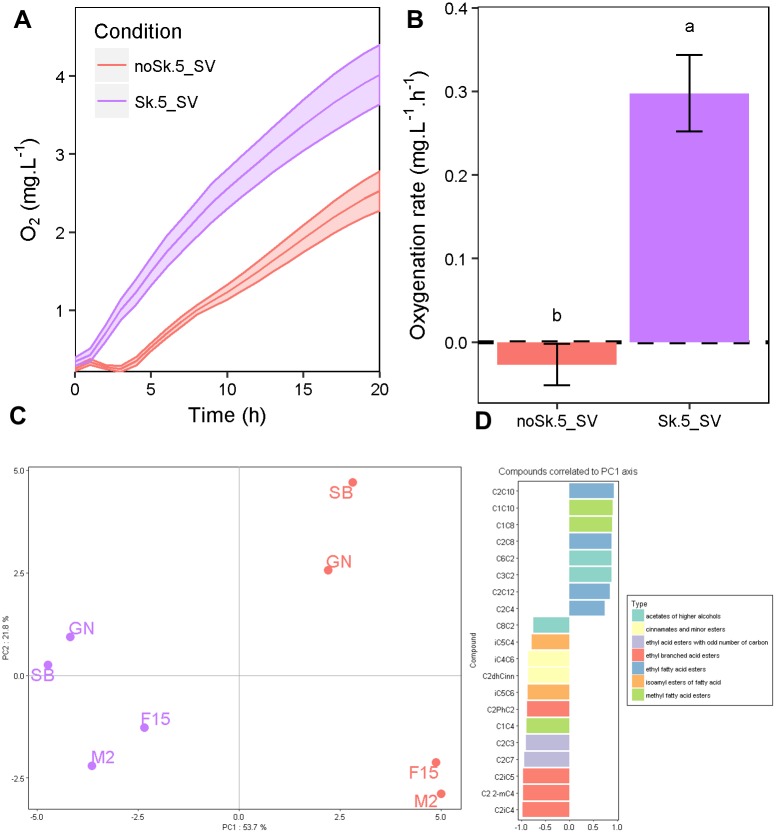
Fig 3. Measure and effect of micro-oxygenation in 5 mL SV.
Panel A. Kinetics of dissolved oxygen concentration in SB14 grape must. The kinetic curves represent the mean of six replicates and the shadows around the lines illustrated the standard errors. Panel B. Concentration of the dissolved oxygen in SB14 after 4 h. The data shown are the means of six replicates and the error bars represent the standard deviations. Different letters indicate significant differences between groups (Tukey’s honest significant difference test, significance level, α = 0.05). Panel C. PCA performed for the 32 esters measured. Each point represents one of the four the strains in noSk.5_SV or in Sk.5_SV. Panel D. Correlation of the variables to the PCA1 axis. The variables that were significantly correlated to the first axis of the PCA were shown (α = 0.05), the bar plot indicated the Pearson’s correlation coefficient.

