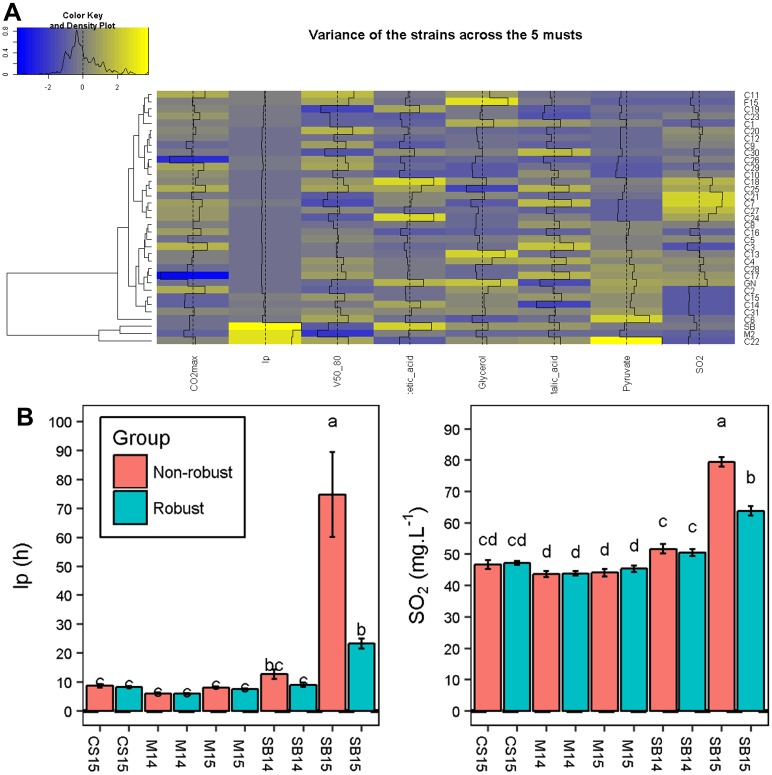
Fig 8. Phenotypic variance of 35 strains in five grape juices.
Panel A. For each strain, the variance was computed for the five average phenotypic values in the five grape musts. Variance is scaled by column and its level is represented by a color palette from blue (lowest variance) to yellow (highest variance) as displayed by the color key. The value of each cell is also displayed by black bar plots and the vertical dashed black lines represents the average variance. Strains are ordered by hierarchical clustering that is represented by the dendrogram on the left. Panel B. Comparison of lp and SO2 between robust and non-robust strains according to grape musts. The data shown are the mean of eight strains (non-robust group) or 27 strains (robust group), the error bars represent the standard error. Different letters indicate significant differences between groups (Tukey’s honest significant difference test, significance level, α = 0.05).

