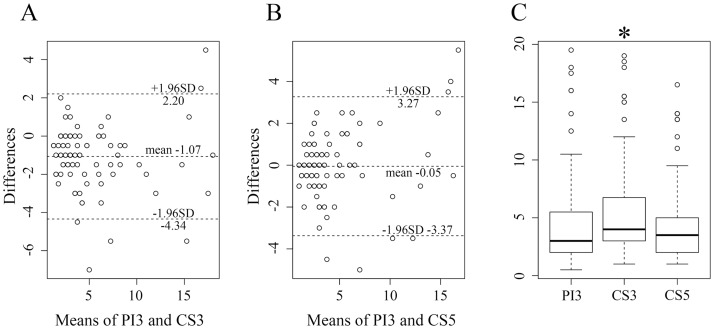
Fig 4. Bland-Altman plots and Box-and-whisker plot of the numbers of high-intensities, which are considered as vessels, observed in the basal ganglia.
(A, B) Bland-Altman plots. The Y-axis unit (differences) is numerical. (A) No significant bias was found comparing PI3 with CS3. (B) Hardly any differences were detected when comparing PI3 with CS5. (C) Box-and-whisker plot. The number for CS3 was significantly higher than that of PI3 (p < .0001) and CS5 (p < .0001). PI3, conventional TOF MRA with an acceleration factor of 3; CS3, compressed sensing TOF MRA with an acceleration factor of 3; CS5, compressed sensing TOF MRA with an acceleration factor of 5.

