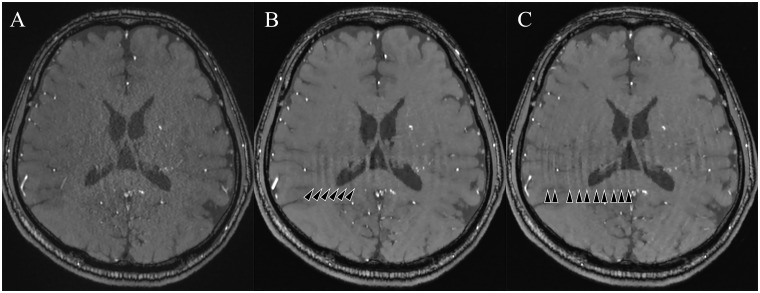
Fig 5. The 2D slice images at the level of the basal ganglia for (A) PI3, (B) CS3, and (C) CS5.
On CS images, some artifacts such as curved stripe patterns (arrowheads) were seen. These artifacts were not observable on the MIP images. PI3, conventional TOF MRA with an acceleration factor of 3; CS3, compressed sensing TOF MRA with an acceleration factor of 3; CS5, compressed sensing TOF MRA with an acceleration factor of 5.

