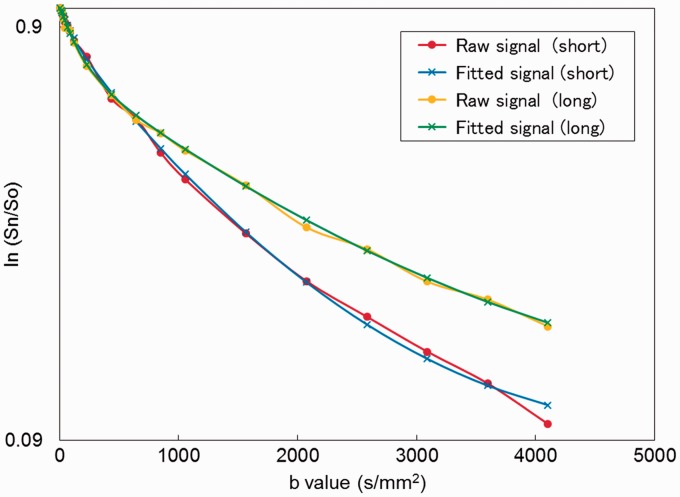
Fig. 3.
Comparison of DW signal decay plots in the MDA-MB-231 xenograft model. DW-MRI signal attenuation at two different diffusion times as a function of b values within the MDA-MB-231 xenograft model (their MR images are shown in Fig. 4). Red circle: raw signals with short diffusion time (9.6 ms), blue cross: fitted signals with short diffusion time (9.6 ms), yellow circle: raw signals with long diffusion time (27.6 ms), green cross: fitted signals with long diffusion time (27.6 ms).

