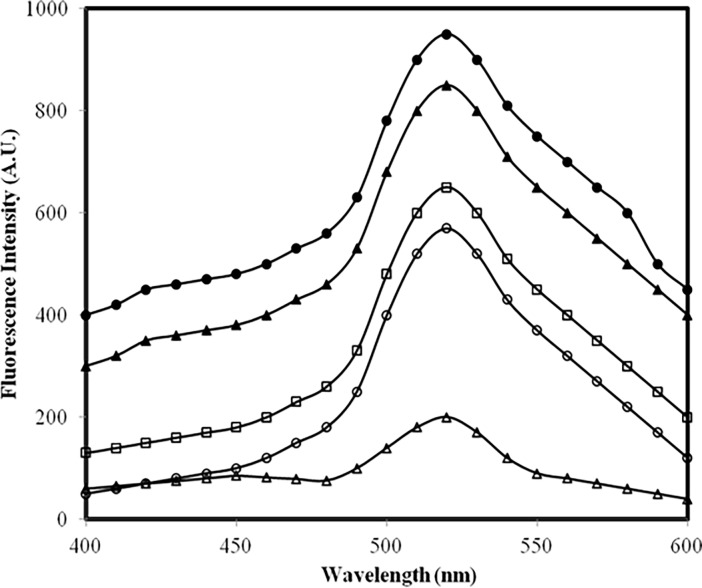
Fig 4. ANS fluorescence assay.
Emission profile of ANS mixed with: native IgG (open triangle), IgG + 5.0 mM glucose (open circle), IgG + 10.0 mM glucose (open square), IgG + 5.0 mM glucose + 6.67 μM MGO (filled triangle) and IgG + 10.0 mM glucose + 6.67 μM MGO (filled circle). All samples were excited at 380 nm.

