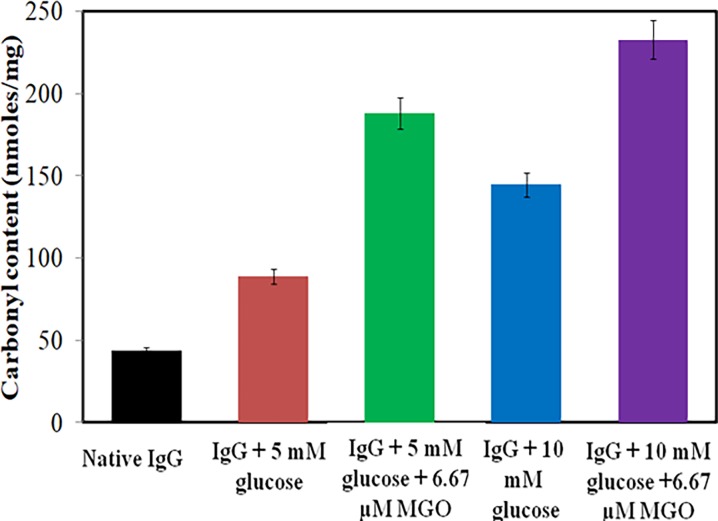
Fig 5. DNPH assay.
Carbonyl content in native IgG (black), IgG + 5.0 mM glucose (red), IgG + 5.0 mM glucose + 6.67 μM MGO (green), IgG + 10.0 mM glucose (blue) and IgG + 10.0 mM glucose + 6.67 μM MGO (purple). Each bar represents the mean ± S.D. of three independent assays in similar experimental conditions. * p < 0.05 was considered as statistically significant as compared to native IgG with each modified group.

