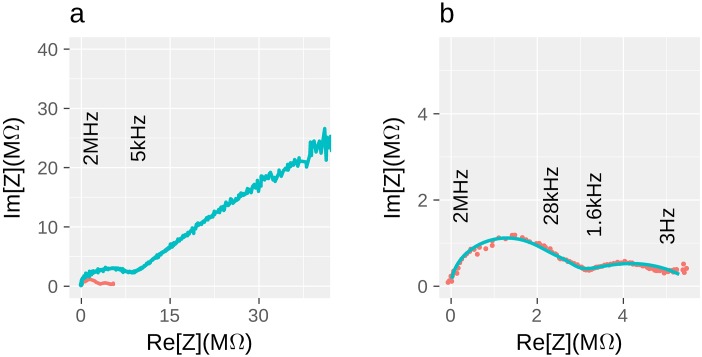
Fig 4. Impedance Nyquist plots.
a) Comparison of the filament (red line) and empty circuit with almost identical nanocontact geometry (blue line); half circle that continued by straight line with the slope of ca. 45° represents reactant diffusion (Warburg element) in test-structure, while nanofilament hodograph consists only of several half-circles. However, the straight line feature for the nanofilament sample can be found in lower frequency region. Frequencies demonstrated on this figure correspond only to the blue line. Full frequency range for all measurements is 1 Hz–2 MHz. Both impedances were acquired at 80% relative humidity. b) Characteristic nanofilament hodograph: experimental data (red dots) and calculated line for equivalent scheme (blue line).

