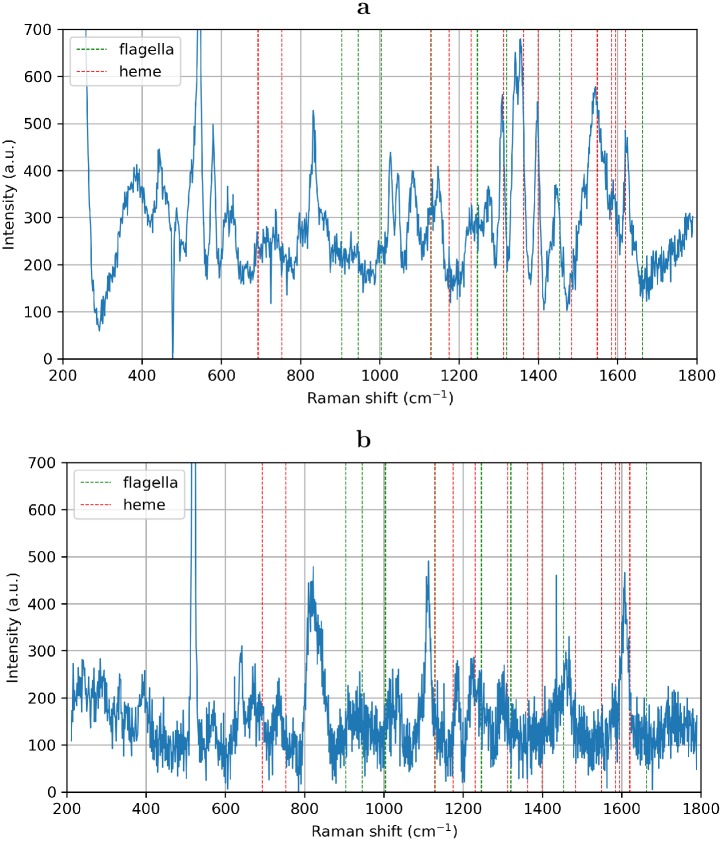
Fig 7. Raman spectroscopy.
Surface Enhanced Raman Spectrum (SERS) of nanowires immobilized on the surface of silver colloid substrate and Raman spectra of nanowires embedded in metal film. Dashed red lines correspond to the perfectly matching cytochrome spectral lines. Dashed green lines correspond to flagellin spectrum. Tabulated data and comparison with earlier published results of Raman spectroscopy of bacterial colonies and various bacterial proteins are presented in S1 Table.

