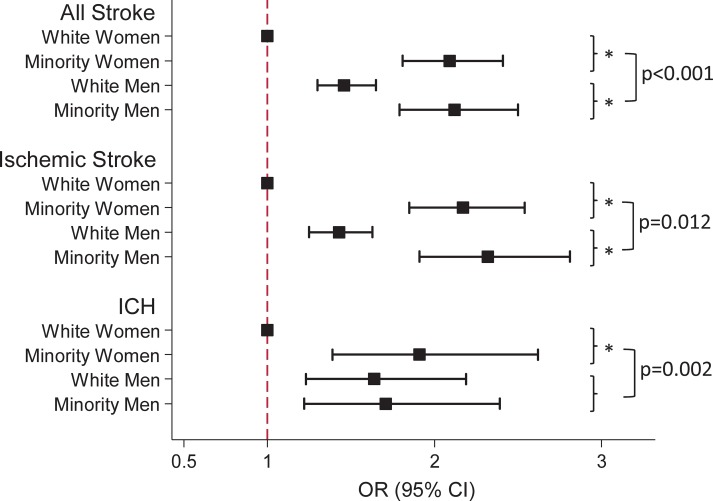
Fig 1. Graphic representation of odds ratios of PEG among ethnic/racial minority women, white men, and ethnic/racial minority men, compared to white women as reference.
Data are presented for all stroke (top panel), and stratified by stroke subtype (medium and lower panel), respectively. * indicates a p-value <0.001 for comparison of PEG in ethnic/racial minority vs. white for each sex. P-values for interaction following square brackets compare the odds of PEG in ethnic/racial minorities vs. white between men and women. OR: odds ratio; CI: confidence interval; ICH: intracerebral hemorrhage.

